
Effective Binary Options Trading Strategies
📈 Master binary options trading with clear strategies tailored for South African markets. Learn decision-making, risk control, and tools for consistent success.
Edited By
Henry Wallace
Binary options trading depends heavily on spotting the right market movements at the right time. Choosing the best indicator can significantly improve your chances of making profitable trades. In a market teeming with noise, indicators help filter important signals from mere fluctuations.
Indicators fall mainly into two camps: trend-following and momentum. Trend indicators, such as Moving Averages, give clues about the overall direction of asset prices—whether they’re generally moving upwards or downwards. Momentum indicators, like the Relative Strength Index (RSI), measure speed and strength behind price moves, often signalling overbought or oversold conditions.

Picking an indicator that suits your trading style and the asset’s behaviour is critical; no one tool works perfectly in all conditions.
Binary options require making quick yes-or-no decisions — essentially, will an asset’s price be above or below a certain level after a fixed time? Indicators can guide these decisions by highlighting:
Entry points: When to start a trade, based on likely price movement
Exit points: When a position might soon reverse or lose momentum
Market conditions: Whether the market is trending or choppy, influencing strategy choice
For instance, combining a 14-period RSI with a 20-day Exponential Moving Average can give a clearer picture. If the RSI drops below 30 (oversold) while price stays above the 20-day EMA, a trader might expect an upward bounce.
Asset class and volatility: Forex pairs behave differently from South African stocks or commodities like gold. Some indicators work better with certain volatility levels.
Timeframe: Binary options often have short expiry times (minutes to hours). Indicators that react too slowly may miss key moves.
Simplicity over complexity: Complex indicators can confuse and delay decisions. Many experienced traders rely on two or three reliable indicators rather than numerous ones.
Backtesting and practice: Try indicators in a demo environment to see how they perform before risking real money.
Finding the right indicator is part art, part science. It's not about using the most popular tool, but the one that fits your specific approach and market.
With a firm grasp of indicators and their roles, you can build strategies that better navigate South Africa's dynamic markets and give yourself a trading edge.
Grasping the basics of binary options is key before plunging into trading. These financial instruments let traders predict whether an asset’s price will be above or below a set level at a specific time. Unlike traditional trading, the outcome is simple — a fixed payout or nothing. This straightforward setup makes binary options popular, especially among those looking for clear, time-bound results in South Africa's often volatile markets.
Binary options are contracts based on a simple yes/no proposition: Will the underlying asset’s price be above or below a certain point when the option expires? For example, if you trade on the JSE’s Top 40 index, you might bet that the price will rise above 70,000 points in the next 15 minutes. If your prediction holds true at expiry, you receive a pre-set payout, otherwise you lose your stake. The fixed risk and reward appeal to many traders but also mean decisions must be precise and timely.
Market volatility can be a double-edged sword for binary options traders. Sudden price swings can rapidly wipe out your position or yield quick gains. For instance, during Eskom load shedding stages that disrupt economic activity, market reactions can get unpredictable. This heightened volatility demands keen attention and swift reaction to avoid losses. Even in normally steady periods, unforeseen events — like political announcements or currency fluctuations affecting the rand — can cause rapid shifts that challenge common indicators.
Binary options often have expiry times as short as 60 seconds to a few minutes. This puts enormous pressure on traders to act fast, relying on split-second analysis. Unlike shares trading where investors might hold positions for weeks or months, here decisions must be made quickly to catch fleeting opportunities. For example, a sudden spike in the rand-dollar exchange rate might call for a rapid call or put trade within minutes. If your chosen indicator lags or generates unclear signals, you risk missed trades or unnecessary losses.
With expiry times counting down, there’s little room for deep market analysis. Traders must depend largely on real-time data, relying on indicators designed to offer quick and reliable signals. There’s no space for prolonged study of fundamentals or external news; you must filter out the noise and focus on clear patterns. This makes it critical to select indicators that balance speed and accuracy well, especially in South Africa where markets may be influenced by sudden news such as SARB monetary policy updates or abrupt changes in municipal service delivery that affect local businesses.
Understanding the stakes and challenges of binary options trading equips you to choose the right tools and indicators, ultimately improving your chances of success in a fast-moving environment.

Trading indicators are essential tools that help binary options traders make sense of price movements and market trends. They provide signals that attempt to predict whether an asset's price will rise or fall within a given timeframe, which is critical for the time-sensitive nature of binary options. Understanding popular indicators and how they work allows traders to select tools that fit their trading style and improve decision-making accuracy.
Moving Averages help smooth out price data by calculating the average price over a specific period. This reduces noise from short-term fluctuations and highlights the overall trend direction, whether upward, downward, or sideways. For binary options, simple moving averages (SMA) or exponential moving averages (EMA) help traders identify entry points – for instance, a bullish signal might occur when a short-term average crosses above a longer-term average.
MACD (Moving Average Convergence Divergence) expands on moving averages by measuring the difference between two EMAs (usually 12-day and 26-day) while also including a signal line (9-day EMA) to identify momentum shifts. MACD is useful for spotting changes in trend strength and direction. When the MACD crosses above the signal line, it can signal a buy opportunity; crossing below suggests a sell. This indicator adds an extra layer to trend-following strategies, helping traders avoid false breakouts common in volatile markets.
The Relative Strength Index (RSI) quantifies the speed and change of price movements to indicate overbought or oversold conditions. Plotted between 0 and 100, values above 70 typically suggest an asset might be overbought (potential sell signal), while those below 30 indicate oversold conditions (potential buy signal). RSI is valuable for binary options traders looking to capitalise on short-term reversals, especially during choppy market conditions.
The Stochastic Oscillator compares a closing price to its price range over a set period, displaying values between 0 and 100. Like RSI, it highlights overbought and oversold zones, but it also focuses on price momentum in a slightly different way. Traders watch for the %K line crossing the %D line as a trigger to buy or sell. The oscillator’s responsiveness suits fast-paced binary options markets where small shifts in momentum can signal potential trades.
Bollinger Bands consist of a moving average (middle band) and two standard deviation bands above and below it. These widen or narrow depending on market volatility. When the bands expand, it signals increased market volatility; when they contract, it suggests a quiet market. Binary options traders use Bollinger Bands to identify breakouts or reversals – for example, a price touch at the lower band followed by a bounce can hint at an upward move.
Average True Range (ATR) measures market volatility based on the average range between high and low prices over a specific period. It doesn’t indicate direction but tells traders how much an asset moves on average. Understanding ATR helps traders adjust their strategy and manage risk, particularly when deciding trade expiry times in binary options, ensuring they aren’t caught out by sudden price spikes or drops.
Knowing the right blend of indicators and how to read their signals equips traders for the rapid decisions demanded by binary options contracts, ultimately improving the odds of profitable trades.
When selecting an indicator for binary options trading, several key factors come into play. Not every indicator fits every trader or market condition, so understanding what to look for is vital to making sound decisions. These factors help you narrow down tools that match your trading goals, style, and the unique challenges of short-term binary options.
Accuracy is simply how well an indicator forecasts price movement. An accurate indicator reduces guesswork and increases your chances of making profitable trades. For example, the Relative Strength Index (RSI) can effectively signal overbought or oversold conditions, but only if adjusted properly for the asset's volatility. Keep in mind that no indicator guarantees success; even reliable ones produce false signals, especially during unexpected news events or market shocks. Evaluating an indicator’s past performance through backtesting can give you a good idea of its reliability.
Indicators that are complex or produce ambiguous signals can slow your reaction time, which isn't ideal for binary options where every second counts. Choose indicators with clear, straightforward output. Moving averages, for example, provide simple crossover signals that are easy to spot and act on. On the other hand, more advanced indicators like MACD require understanding histogram behaviour and signal lines, which might confuse a beginner. Your indicator should help clarify, not complicate, your trading decisions.
Different indicators perform better at certain timeframes or styles. Scalpers, looking for trades that last minutes, benefit from momentum indicators like the Stochastic Oscillator that react quickly to price changes. Swing traders, holding positions over days, might prefer trend indicators such as Moving Averages to filter out noise. Make sure the indicator aligns with your preferred trading timeframe to avoid misreading signals. For instance, using Bollinger Bands on a 5-minute chart demands swift response, which might feel rushed for some.
Using more than one indicator can provide a fuller picture, but care is needed to avoid conflicting signals.
Some indicators might tell opposing stories. For instance, a momentum indicator says the market is overbought, while a trend indicator suggests prices will keep rising. Such contradiction can paralyse decision-making. It's best to combine indicators that complement each other to reduce confusion. For example, pairing a trend indicator like the MACD with a momentum indicator like RSI helps confirm market direction and timing.
Complementary indicators measure different aspects of price action — trend strength, momentum, or volatility. Using an ATR (Average True Range) indicator alongside a Moving Average could help you spot a strong trend with low volatility, ideal for binary options with tighter expiry times. This combination improves the probability of successful trades while keeping your strategy balanced. In contrast, too many indicators can clutter your analysis and slow decisions, so aim for quality over quantity.
Picking the right indicator requires balancing accuracy, simplicity, compatibility with your trading style, and cautious use of combinations. This practical approach can sharpen your edge in South Africa’s fast-moving markets.
A systematic approach to applying trading indicators sharpens your decision-making in the fast-moving binary options market. By setting parameters correctly, testing strategies rigorously, and interpreting signals carefully, you can avoid costly mistakes and improve your chances of success.
Adjusting parameters such as periods for different timeframes matters because market dynamics shift depending on your chosen trading window. For example, a 14-period Relative Strength Index (RSI) might work well for intraday trades but will be too sensitive for longer-term positions. Tweaking these periods helps match the indicator's responsiveness to your preferred expiry times, whether it's 5 minutes or 1 hour.
Customising thresholds also plays a vital role. Take the RSI again: the standard overbought and oversold levels sit at 70 and 30, but you might find adjusting these to 80 and 20 reduces false signals in volatile markets like the JSE. The key is to align the thresholds with current market behaviour and your personal risk appetite, ensuring signals are meaningful and timely.
Using historical data lets you see how your indicator settings would have performed during past market moves. This isn't about predicting the future but about spotting patterns—like how Bollinger Bands expand during sharp price swings or how MACD crossovers have signalled trend changes. Backtesting on South African equities like Naspers or Sasol can give you a feel for local market quirks.
Demo trading environments provide a no-risk space to try your refined strategies under real-time conditions. Many brokers offer demo accounts where you can practise without losing capital. This step helps bridge the gap between theory and reality, allowing you to feel the pressure of live trading while honing your responses to actual price moves and indicator signals.
Confirming indicator signals with price action means you don't blindly follow any single cue. For instance, a bullish RSI signal gains more weight if price charts show strong support levels or bullish candlestick patterns. This layered approach helps you filter out noise and enter trades backed by clearer evidence.
Recognising false signals is a skill you develop by watching how indicators behave during choppy or sideways markets. A Stochastic Oscillator might flash frequent overbought conditions without price moving much, warning you against jumping in too soon. Being alert to these patterns keeps you from chasing trades based on misleading signals, ultimately saving both capital and stress.
A disciplined, step-by-step method in applying indicators turns guesswork into informed trading. Patience to test and validate pays off in clear, confident decisions that suit South Africa's dynamic markets.
Successful binary options trading depends not just on choosing the right indicators but also on avoiding common pitfalls. Many traders fall into traps that can undermine their strategies and lead to losses. Understanding these mistakes helps you navigate the market more confidently and improve your trading decisions.
Relying solely on one indicator can give a very narrow view of the market. Each indicator has its strengths and weaknesses; for instance, a Relative Strength Index (RSI) might show overbought conditions, but without confirming trend-direction from something like a Moving Average, the signal can be misleading. Imagine basing your entire trade on one signal and watching the market move against you because the broader context wasn't considered. Combining at least two complementary indicators often paints a clearer picture and reduces the chance of false signals.
Indicators mainly analyse past price data and patterns, but they rarely capture sudden external influences like economic announcements, political unrest, or major company news. For example, during South Africa's frequent Eskom load shedding announcements or when new interest rates are released by the South African Reserve Bank (SARB), market behaviour can shift quickly and unpredictably. Traders who ignore such events risk being blindsided, as their indicators may lag or fail to signal these swift changes. Staying informed about key market news alongside indicator readings is essential.
Some traders believe more is better, piling up indicators and hoping multiple confirmations will guarantee success. However, too many indicators can cause confusion and contradictory signals, making it harder to make clear decisions. For instance, combining Bollinger Bands, Stochastic Oscillator, MACD, and several moving averages without proper strategy can lead to paralysis. It’s better to understand a few well-chosen indicators deeply and use them properly rather than overcrowd your charts with unnecessary tools.
Clear, focused analysis beats clutter every time when trading binary options.
Avoiding these common mistakes — relying on a single indicator, ignoring news and context, and overloading your charts — helps you stay sharp and react appropriately to market changes. Use indicators as guides, not gospel, and always keep an eye on the bigger picture.
📈 Master binary options trading with clear strategies tailored for South African markets. Learn decision-making, risk control, and tools for consistent success.
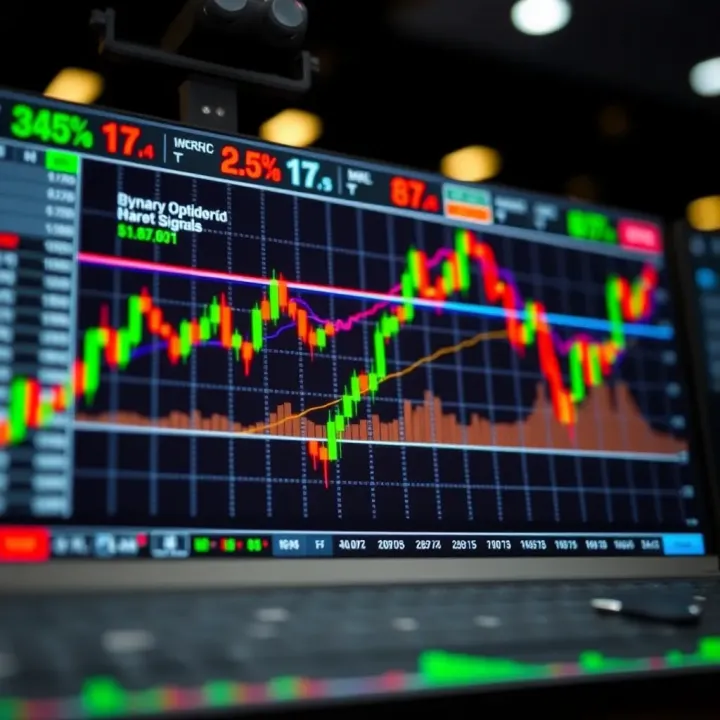
📈 Learn how binary options trading signals work and how South African traders can assess their reliability, risks, and costs for smarter decisions in this market.

📊 Dive into graphic trends in binary options trading! Learn chart patterns, technical indicators & strategies tailored for South African traders. 🇿🇦

Explore how free binary options signals can assist South African traders 🎯. Learn to spot reliable providers, avoid scams, and smartly use signals for better trades 📉📈.
Based on 9 reviews