
Understanding Candlestick Patterns in Forex Trading
📊 Learn how to read candlestick patterns in forex trading for smarter market reads. Spot key signals and sharpen your decisions with practical tips. 💡
Edited By
Isabella Turner
Understanding forex candlestick patterns is a key skill for anyone involved in trading the currency markets. These patterns offer visual clues about market sentiment and potential price moves, giving traders an edge when deciding on entry or exit points.
A candlestick captures price action within a set period — from open through close plus the highs and lows — and presents it as a simple shape. Recognising the shapes and sequences forms the basis of technical analysis in forex trading.
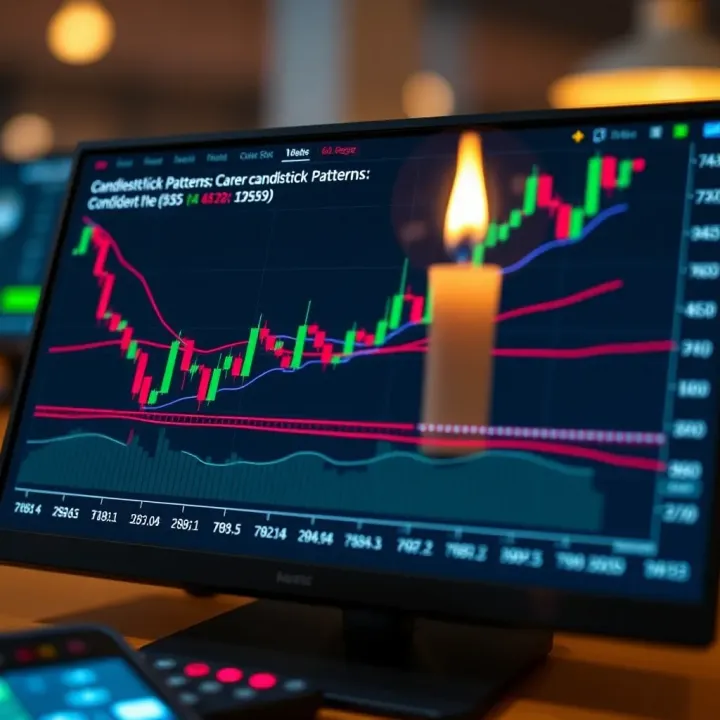
The most valuable patterns to watch out for tend to be those signalling a probable market reversal or continuation. For example, a hammer candlestick at the bottom of a downtrend suggests buyers might be stepping in, potentially pushing prices higher. Conversely, a shooting star appearing at the top of an uptrend often warns of a pullback or reversal.
Remember, no single candlestick tells the whole story. It’s the context — such as the trend’s strength, volume, and location — that confirms the pattern’s reliability.
Below are key points to keep in mind when working with forex candlestick patterns:
Timeframe matters: Patterns on longer timeframes, like daily or weekly charts, generally carry more weight than on 5-minute charts.
Look for confirmation: Wait for the next candle or market action to validate the pattern before committing.
Combine with other tools: Use support and resistance levels, moving averages, and indicators like RSI to back up your read.
Practice reading patterns in live market conditions: Historical data only helps so much; real-time monitoring builds instinct.
Traders often use a cheat sheet of reliable candlestick patterns as a quick reference to speed up decision-making during trading hours. This guide will focus on patterns that have proven useful to those active in the forex market and provide clear examples on how to spot them.
Getting comfortable with these patterns helps you read the market’s mood in real-time rather than relying solely on lagging indicators. It’s about seeing the price action through the lens of market psychology — who is winning, buyers or sellers? That insight can make your trading sharper and more confident.
In the sections that follow, we’ll break down each essential forex candlestick pattern, describe what it looks like, and explain how to interpret and apply it to your trading strategy effectively.
This straightforward approach will suit traders and analysts at all levels who want practical knowledge without wading through unnecessary jargon or complex theory.
Getting a solid grip on the basics of forex candlesticks is vital before you start spotting patterns and making trades. Candlesticks pack a lot of information into a simple visual form, showing not just price levels but also the battle between buyers and sellers during a trading period. For someone tracking currency pairs, this helps turn raw data into practical insights you can act on.
A single candlestick reflects four key prices over its set time frame: Open, Close, High, and Low. The open is where the price started, while the close shows where it ended. The tallest points, the high and low, give you the maximum and minimum prices reached. Take a 30-minute EUR/ZAR candle, for instance: if it opens at R18.50, peaks at R18.70, drops to R18.45, and closes at R18.65, you’ll see a clear picture of price movement within that half hour.
This snapshot is essential because it reveals volatility and price direction at a glance. Whether the price moved up or down, and how dramatic those swings were, can shape your next decision.
The distinction between bullish and bearish candles is equally critical. A bullish candle means the closing price is higher than the opening price, signalling upward momentum. Traders often see this as buying pressure or optimism in the market. Conversely, bearish candles close lower than they opened, hinting at selling pressure and potential downtrends.
For example, during a bullish candle, the body is typically filled with a lighter colour (like green or white), while bearish candles might be red or black. The size of this body also counts: a big bullish candle after a series of bearish ones could indicate a trend reversal, a heads-up to act or watch closely.
Candlestick charts pack more information than traditional line charts, which just link closing prices over time with a simple line. While line charts give you the general price trend, they ignore the volatility and range within each trading period. Bar charts, meanwhile, are a bit more informative than line charts because they show high, low, open, and close prices, but they don’t use the filled body visual that makes candlesticks so easy to interpret at a glance.
Candlestick charts' unique strength lies in how they combine the open-close range with high-low wicks, making it simple to recognise shifts in momentum and market sentiment at a glance.
The advantages of candlestick charts go beyond visual appeal. They make spotting patterns — like hammers, dojis, or engulfing candles — straightforward, which can hint at trend reversals or continuations without needing hours of analysis. Traders using these charts can quickly identify key support and resistance zones, confirm trends, and time their entries and exits more effectively. Simply put, candlestick charts give you a fuller view of what’s happening beneath the surface of price moves.
In trading, a quick read of the market action is a powerful tool. Candlesticks offer that read clearly and efficiently, saving you from digging through endless price numbers.
Understanding these basics forms the foundation for any trader hoping to decode forex candlestick patterns reliably—and that’s what the rest of this guide helps you do.
Single-candlestick patterns pack plenty of trading signals into just one bar. The neat thing about them is their simplicity — you can spot them quickly on a forex chart, which helps you act fast in volatile markets. They often show strong shifts in market sentiment, making them essential for traders who want to time entries and exits more confidently.
The Hammer and Hanging Man look similar but signal different things depending on the trend they appear in. A Hammer forms after a downtrend and suggests buyers are stepping in to push prices higher, signalling a possible bullish reversal. Picture it like a trader hitting the bottom and bouncing back. Conversely, the Hanging Man shows up at the top of an uptrend, hinting sellers might be gaining a foothold, which could lead to a bearish turnaround.
The pattern itself isn’t enough without context. For example, a Hammer in the middle of sideways price action won’t have much to say. You want to see it after a sustained move down to suggest exhaustion of sellers. Plus, confirmation the next day—like a higher open or close—is key. Without confirmation, you risk falling for false alarms.
The Doji candle is unique because its open and close are almost identical, leaving a cross or plus sign shape. It tells you the market can’t decide which way it wants to go — neither buyers nor sellers took control decisively. This indecision can precede a change in trend or continuation, so it’s a flag to watch the next candles closely.
Different Doji types bring extra clues. The Long-Legged Doji has long wicks on both ends, highlighting extreme indecision. The Dragonfly Doji, with its long lower shadow and no upper wick, suggests sellers pushed prices down but buyers fought back strongly. Conversely, the Gravestone Doji shows a long upper wick and little to no lower shadow, signalling buyers tried but failed to keep prices high. Each variation tweaks the narrative on market strength and possible turns.
The Shooting Star pops up after an uptrend and looks like a small body with a long upper wick. It hints that buyers pushed prices up during the session but sellers took control before the close, making it a signal for a potential bearish reversal. The Inverted Hammer is its cousin but forms at the end of a downtrend, signalling buyers might be gaining ground despite bears trying to drag prices lower.
Again, context counts. A Shooting Star appearing mid-trend or in consolidation lacks the punch to act as a turn signal. Traders usually watch for this pattern at clear tops with volume confirming a shift in momentum. The Inverted Hammer needs to show up after a decline, ideally with a bounce the following day, before you can trust it as a suggestion prices might rise.
These single-candle patterns give traders immediate cues but always pair them with context and follow-up candles before making trading decisions. They’re like quick snapshots—valuable only when read alongside the full story of price action.
Multi-candlestick patterns provide a richer context than single candles alone. They reveal how market sentiment shifts over two or more periods, helping traders spot potential trend reversals or continuations. For example, a one-candle pattern might look promising, but its follow-up candle can confirm or nullify that signal. Understanding these patterns boosts your ability to anticipate price moves with greater confidence.
Experienced traders use multi-candlestick patterns alongside other analysis tools to identify clearer entry and exit points. Let's take a closer look at some of the most common examples.
A bullish engulfing pattern occurs when a small bearish candle is directly followed by a larger bullish candle that completely swallows the body of the previous one. This shift suggests a strong change in momentum from sellers to buyers. For instance, after a downtrend in the EUR/USD pair, spotting a bullish engulfing candle on a 1-hour chart might hint that buyers are stepping in seriously.
This pattern holds practical value because it marks a potential bottoming point. Traders often watch for this setup near known support levels, using it as a prompt to enter long positions while keeping stops just below recent lows.
The bearish engulfing pattern is the reverse. A small bullish candle is followed by a larger bearish candle engulfing it fully. It signals sellers overpowering buyers and often appears at market tops after an uptrend. In the rand/dollar market, a bearish engulfing just below resistance might warn that the bulls are losing steam.
Practically, this pattern advises caution for longs and could be a signal to consider short positions or tighten stop-loss orders. The key is context; a bearish engulfing in a strong trend doesn’t always result in a full reversal but can indicate a temporary pullback.
The morning star and evening star are classic three-candle reversal patterns. A morning star appears after a downtrend and starts with a long bearish candle, followed by a small-bodied candle (often a doji) signalling indecision, then a bullish candle closing well above the midpoint of the first candle. This formation suggests exhaustion of selling pressure and the start of a new uptrend.
Conversely, the evening star emerges at an uptrend's peak, signalling a possible downturn. It begins with a strong bullish candle, next a small real body highlighting uncertainty, and then a bearish candle that closes deep into the first candle's body.
When trading these stars, timing and confirmation matter. Traders typically wait for the third candle to close before acting, reducing risk of false signals. Combining this pattern with support or resistance levels or volume spikes sharpens reliability.
It's wise to set stop-loss orders just beyond the pattern's extremes. These stars work best on daily or 4-hour charts where price action gives a clearer picture, avoiding noise found on shorter intervals.
A harami pattern features a large candle followed by a smaller candle fully nested within the first candle’s body. A bullish harami shows a big bearish candle first, then a smaller bullish candle, hinting sellers are tired and buyers may gain control. The bearish harami flips this, starting with a large bullish candle, followed by a smaller bearish one.
These setups are subtle and hint at possible trend pauses or reversals, often signalling traders to stay alert rather than act immediately.
Harami patterns require confirmation. This comes from the next candle’s direction or from additional signals such as breaking a moving average or a clear support/resistance level holding firm. Without these, haramis can just be instances of price consolidation.
Using volume or momentum indicators alongside haramis helps confirm if the market really intends to reverse or if it’s a brief hesitation. Traders often wait for confirmation before opening positions.
Multi-candlestick patterns offer better context for trading decisions, but they must be combined with market structure and risk management to avoid costly mistakes.
By mastering these patterns and knowing when to trust them, traders operating in volatile forex markets can improve timing and potentially increase profits.
Candlestick patterns provide valuable clues about market sentiment, but relying on them alone can be risky. Applying these patterns effectively means combining them with other trading tools and solid risk management. This approach helps confirm signals and avoid costly mistakes, which is especially important when you’re trading volatile markets like the forex space.
Support and resistance levels mark price points where the market tends to react. When a bullish candlestick pattern forms near a known support level, it adds weight to the potential for a price bounce. Conversely, a bearish pattern near resistance suggests selling pressure might push the price down. For example, spotting a hammer at a strong support level in the USD/ZAR pair could signal a buying opportunity, provided other factors align.
Traders often find this combination practical because it ties candlestick signals to real areas where traders place orders, making patterns less prone to random noise. This makes the entry points clearer and enables setting tighter stop-loss levels, which improves risk control.
Volume is a strong confirmation tool—high volume during a candlestick pattern signals genuine interest and conviction behind the move. For instance, a bullish engulfing pattern with rising volume may indicate a stronger chance of a trend reversal.
Moving averages smooth price data and show trend direction. When a candlestick pattern aligns with a crossover or bounce from a moving average, it adds confidence. Say a shooting star forms just below the 50-day moving average; this could hint at a rejection of higher prices. Together, volume spikes and moving average tests help filter reliable patterns from false alarms.
Placing stop-loss orders is non-negotiable when trading candlestick patterns. The unpredictable nature of forex markets means that even textbook setups can fail. Stops act like a safety net, limiting your losses if the market moves against you.
A common method is to place stops just beyond the candle’s high or low that formed the pattern. For example, if trading a bullish hammer, a stop-loss slightly below its low makes sense. This way, you respect the pattern’s boundaries while protecting your capital from unexpected swings.
Candlestick patterns sometimes give false signals, especially in choppy or low-volume markets. To avoid getting caught out, wait for additional confirmation before entering a trade. Look for alignment with other technical tools like support/resistance, volume increases, or trend direction.
Patience pays off. Jumping in as soon as a pattern appears can lead to whipsaws—where the price quickly reverses. Instead, monitor how the market evolves after the pattern forms. For example, confirm that a morning star pattern is followed by a higher close before committing funds. This reduces the risk of false hopes and losses.
Successful trading with candlestick patterns involves not just recognising shapes but understanding their context, combining tools, and practising strict risk discipline.
By weaving candlestick patterns into your broader trading strategy with these techniques, you’ll have a much better chance to trade forex with confidence and durability.
Crafting a personal forex candlestick cheat sheet can sharpen your trading edge by keeping vital signals front and centre. Such a cheat sheet isn’t just a list; it’s a tailored tool highlighting patterns most relevant to your trading habits and markets. By focusing on the patterns that really move the needle, you save time and reduce confusion during fast-paced trading moments.
When selecting patterns for your cheat sheet, concentrate on those with a track record of reliable signals. For example, the bullish engulfing and morning star patterns often indicate strong reversals, making them valuable starters. Including less dependable or rare patterns may clutter your sheet and slow your decision-making. Stick to patterns that fit well with your strategy and offer clear entry or exit points.
No two traders operate the same way. If you’re a short-term trader, you might prioritise quick reversal shapes like the doji or shooting star, which signal near-immediate momentum shifts. On the other hand, swing traders might lean more towards patterns like the evening star or harami that unfold over several sessions. Tailoring your cheat sheet to your preferred timeframes and risk appetite makes it genuinely practical during trades, rather than a generic reference.
A visual aid beats pages of text when time is tight. Incorporate simple diagrams showing candle shapes alongside brief notes on their typical meaning—something like "Bullish Engulfing: strong buy signal after a downtrend". Colour coding, such as green for bullish and red for bearish patterns, helps with rapid recognition. The goal is that a quick glance gives you enough information without pulling you out of the trading flow.
Markets change, and patterns sometimes behave differently depending on broader conditions. Review your cheat sheet periodically to remove patterns that no longer perform well or add new ones you’ve found helpful. For instance, after a few months of trading, you may realise that the inverted hammer works better for you in a sideways market and adjust your notes accordingly. Keeping your cheat sheet current ensures it evolves alongside your trading journey rather than gathering dust.
A personalised candlestick cheat sheet isn’t just about memorising patterns. It’s a practical companion for real-time decision-making, crafted to fit your unique approach and sharpen your forex trades.
📊 Learn how to read candlestick patterns in forex trading for smarter market reads. Spot key signals and sharpen your decisions with practical tips. 💡

🔍 Learn how to spot hammer candlestick patterns and use them in trading for better market reversal insights. Practical tips for clear, effective analysis.
📈 Understand how candlestick chart patterns reveal market moves and aid your trading strategy. Get practical tips plus handy PDF guides for quick reference.

📉 Learn how Doji candlestick patterns reveal market indecision and hint at trend changes. Master key types and interpret them alongside other indicators for smarter trades.
Based on 5 reviews