

Understanding Hammer Candlestick Patterns
🔍 Learn how to spot hammer candlestick patterns and use them in trading for better market reversal insights. Practical tips for clear, effective analysis.
Edited By
Sophie Clarke
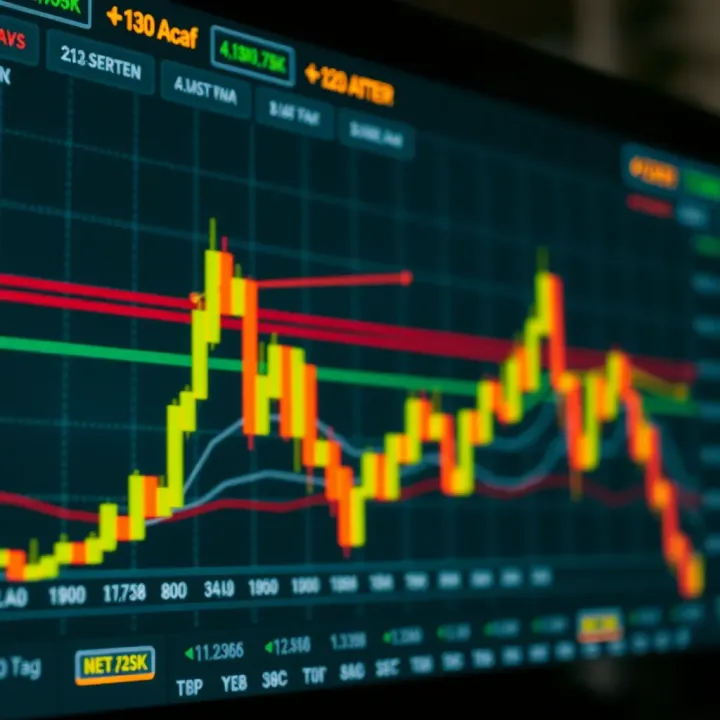
Candlestick chart patterns remain one of the most effective tools for traders and investors aiming to read market sentiment and price action clearly and efficiently. Originating in Japan, these patterns quickly convey whether buyers or sellers are in the driving seat over specific periods — be it minutes, days, or weeks.
Understanding these charts goes beyond spot-checking individual candles. It's about recognising arrangements like the hammer, doji, or engulfing patterns which hint at potential reversals or continuations in price trends. For instance, a hammer forming at a support level often signals a coming rally, while a doji can indicate market hesitation and a possible turning point.
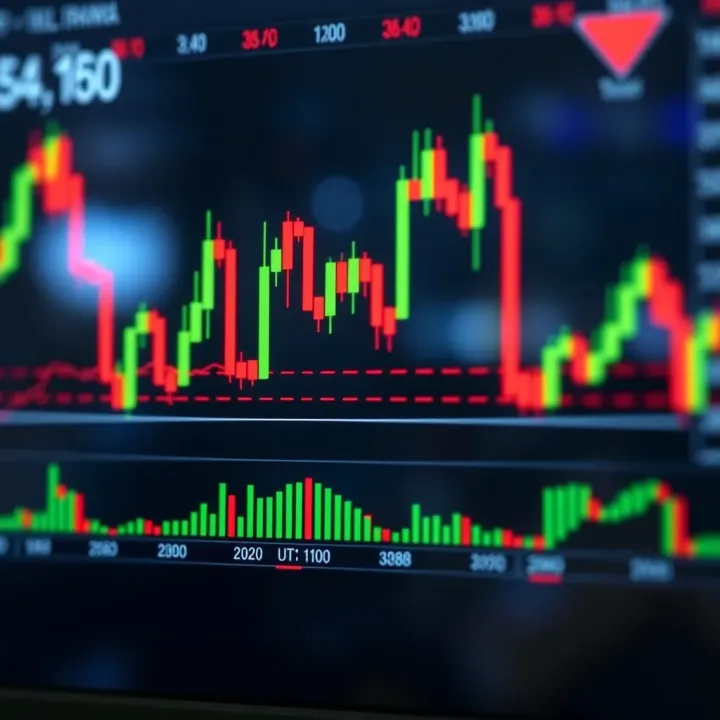
Mastering candlestick patterns helps you identify probable entry and exit points with more confidence, reducing guesswork in volatile markets.
Traders in South Africa and beyond benefit greatly by combining candlestick insights with other technical indicators, such as volume or moving averages, for a fuller picture. Practical application means not just spotting a pattern, but contextually analysing it — during loadshedding periods, for example, market reactions might display unusual volatility, affecting patterns.
This guide breaks down the most common, reliable candlestick patterns and explains their practical significance. Plus, it points you towards handy PDF resources to take with you — ideal for quick look-ups while trading on platforms like EasyEquities or when assessing JSE-listed shares.
Whether you’re day trading petrol stocks, investing in property shares, or analysing currency fluctuations, a solid grasp of candlestick charts sharpens your strategy.
In the following sections, you’ll find clear explanations, easy-to-understand examples, and actionable advice to help make sense of what these patterns reveal about market psychology. Keep a printed PDF or digital copy of pattern charts nearby; it’s a proven way to speed up your decision-making process and improve your trading success.
Candlestick charts have become an essential tool for traders and investors looking to understand market movements quickly and accurately. Unlike simple line charts, these charts capture price fluctuations within specific periods by showing the open, close, high, and low prices. This approach offers a more detailed snapshot of market dynamics, which is especially useful during volatile trading sessions. For example, a trader in Johannesburg watching the JSE’s Top 40 stocks can spot intraday price swings more easily using candlestick charts rather than relying on basic charts.
Each candlestick provides a compact summary of price activity within a chosen timeframe, be it minutes, hours, or days. The open price marks where trading started in that period, while the close indicates where it ended. The high and low prices reveal the extremes reached, painting a fuller picture of the trading range. For instance, if a candlestick shows a high of R150 and a low of R140 within one hour, but closes near R148, traders can conclude there was some volatility but a relatively stable finish.
Knowing these four prices helps you evaluate market sentiment. A close higher than the open usually points to buying pressure, and the opposite suggests selling pressure. This is more insightful than just watching the closing price alone because it reveals what happened within the period, not just the end point.
Candlesticks display price changes visually through the body and shadows (or wicks). The body indicates the range between the open and close prices, while shadows show the price extremes beyond the body. This design makes spotting trend strength or potential reversals intuitive. For example, a long green candle with short shadows means strong buying, while a candle with long upper shadows and a small body may indicate buyers lost momentum.
In practical terms, price action traders use these shapes to deduce whether bulls or bears control the market at that moment. It's like having a conversation with the market, where each candle tells part of the story through its form.
Candlestick charts give instant clarity on market conditions. Their colour-coding and shapes make it easy for traders to process complex price data at a glance. Instead of sifting through tables of numbers, you can look at several candles and quickly understand price volatility and trend direction. For example, in the fast-paced world of currency trading, this speed can make the difference between catching an opportunity or missing it.
Because these charts are so effective in conveying information quickly, they reduce analysis paralysis. Traders can react to developments promptly without overcomplicating the decision-making process.
Candlestick patterns reflect the mood of market participants. For example, a series of green candles with higher closes shows buyer confidence, while multiple red candles signal increasing selling pressure. This insight is valuable for judging whether a trend will continue or reverse.
Moreover, recognising certain candlestick shapes, such as Dojis or hammers, helps identify indecision or potential turning points. This understanding helps traders anticipate shifts rather than simply reacting after they occur, which can improve timing and risk management.
Candlestick charts don't just show price—they reveal the battle between bulls and bears, giving you a window into market psychology.
Overall, mastering the basics of candlestick charts helps traders in South Africa and beyond make decisions that are both informed and timely, crucial amid markets influenced by local economic news or global developments.
Recognising common candlestick patterns is key for traders wanting to read market sentiment and predict possible price moves. These patterns offer a snapshot of supply and demand dynamics that helps you decide when to enter or exit trades. Understanding their meaning avoids chasing false signals and enables more confident decisions.
Doji marks indecision. When the open and close prices are nearly the same, the candle forms a cross or plus shape, showing buyers and sellers are at a stalemate. On its own, a Doji isn’t a guarantee of reversal, but when it appears after a prolonged uptrend or downtrend, it signals potential exhaustion. For example, a Doji after a strong rally suggests bulls are losing control, so wait for confirmation before acting.
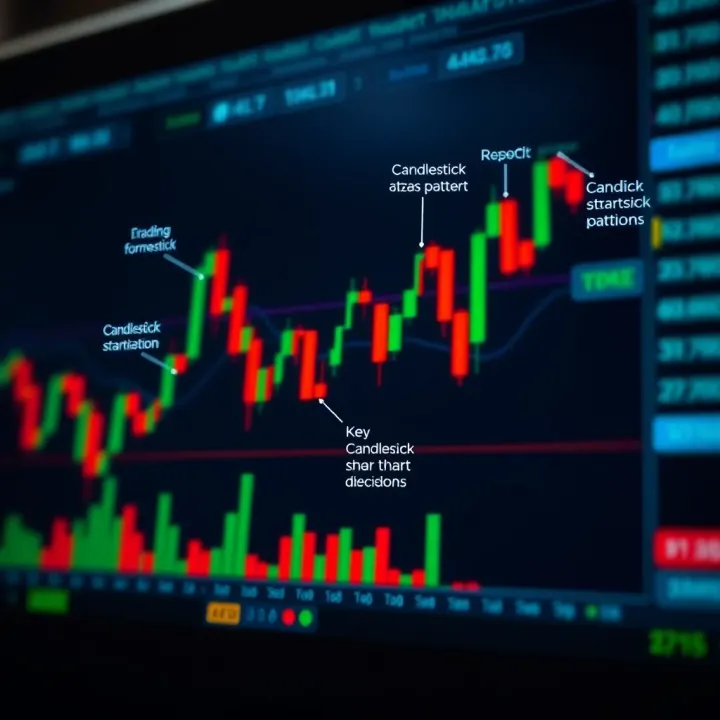
Hammer and Hanging Man resemble each other with a small body and a long lower shadow, but their significance depends on trend context. A Hammer appears after a downtrend and hints at bullish reversal: sellers drove prices down during the day, but buyers pushed it back up by close. Conversely, the Hanging Man occurs after an uptrend and warns of possible bearish reversal, showing buyers failed to maintain higher prices despite earlier strength. Traders should confirm these signals with volume or the next candle’s move.
Inverted Hammer and Shooting Star also look alike with small bodies and long upper wicks. The Inverted Hammer arises after a downtrend, suggesting buyers tested higher prices but met resistance—potential sign of a bottom forming. The Shooting Star surfaces after an uptrend, indicating sellers pushed prices lower after a rally, hinting at a possible top. Both require further evidence before adjusting your position.
Engulfing Patterns feature two candles where the second completely covers the first’s body, signalling a strong shift in momentum. A Bullish Engulfing appears after a downtrend—here, a strong green candle overtakes the previous red candle, signalling buyers taking control. The opposite is true for a Bearish Engulfing following an uptrend. These patterns often prompt traders to prepare for a trend reversal or pullback.
Morning and Evening Stars are three-candle formations that provide clearer reversal signals. The Morning Star happens at the bottom of a downtrend: a long red candle, followed by a small-bodied candle (often a Doji), and then a large green candle. This combo shows selling pressure easing and buyers gaining ground. The Evening Star mirrors this but tops an uptrend, warning of potential declines.
Three White Soldiers and Three Black Crows indicate sustained moves. Three White Soldiers consist of three consecutive long green candles with small wicks, confirming strong bullish sentiment. Traders see this as a reliable sign that the uptrend can continue. The Three Black Crows pattern shows three long red candles in a row, signalling sustained bearish pressure—potentially the start of a downtrend.
Knowing these patterns and their context helps you spot real opportunities instead of reacting to noise. Always check volume and combine patterns with other indicators to increase confidence in your trading moves.
Candlestick patterns offer traders quick insights into price movements, but their true value lies in how you apply them in real trading situations. Using these patterns can sharpen your ability to spot trends, reversals, and key price levels, all of which help make informed decisions on when to enter or exit trades. It's not just about recognising the pattern — it’s about reading the market context alongside other signals to avoid getting caught out.
Volume acts like the heartbeat behind price action; it shows how many traders are backing a move. For instance, a bullish engulfing candlestick followed by high volume suggests genuine buying interest rather than a fleeting flicker. Without volume confirmation, a nice-looking reversal pattern might turn out to be a weak signal, easily reversed by the next candle.
In practice, when a hammer forms at a support level and volume spikes, it’s a stronger signal that buyers are stepping in. Conversely, if the volume is low, the pattern may not hold much weight, and it pays to stay cautious. Combining candlestick signals with volume data helps cut down false alarms and picks trades with clearer backing.
Candlestick patterns rarely work in isolation. Adding indicators like the Relative Strength Index (RSI) or moving averages can give a better sense of trend strength and possible exhaustion points. For example, spotting a shooting star candlestick near an overbought RSI level strengthens the case for a pullback.
Similarly, using moving averages to define the broader trend can help avoid trading against the market momentum. If the price and candle patterns align with a moving average direction, your trades have higher chances of success. This combined approach fits well in fast-moving markets where a single signal can be misleading.
Candlestick patterns gain more relevance when they appear near established support or resistance zones. These levels act as psychological price barriers. For instance, a morning star forming right at a key support line can signal a good entry point.
Support and resistance not only help in pinpointing entries but also aid in planning exits. If a bullish pattern takes shape near support, it suggests buyers will defend that price. On the flip side, bearish patterns near resistance indicate selling pressure. Knowing these zones helps avoid jumping into trades blindly.
Using candlestick patterns effectively includes protecting yourself against losses. Stop-loss orders should be placed beyond recent price action extremes to allow the trade room while limiting risk. For example, after entering on a hammer pattern at support, placing a stop-loss just below the candle’s low can prevent getting stopped out prematurely.
Risk management isn’t just about saving capital; it also helps keep your mind clear during volatile swings. Defining your exit points using candle lows or highs makes your strategy disciplined. This way, you won’t chase the market when things don’t go as planned.
Sound trading decisions depend on blending pattern recognition with volume cues, technical tools, and clear risk controls. Candlestick patterns give you a lens into price behaviour, but how you use that lens makes all the difference.
By integrating these elements, you can use candlestick charts not simply to spot potential moves, but to manage trades confidently and effectively in the South African market or beyond.
In understanding candlestick patterns, having reliable PDF resources at hand can make a real difference. These guides condense essential information into neat packages you can consult anytime, without needing an internet connection. They’re especially useful when you’re on the go or want to cross-check pattern details quickly before making trading decisions.
Financial websites like Investopedia, MarketWatch, and reputable market analysis firms often offer free or paid downloadable PDF guides on candlestick patterns. Such resources typically cover the basics, common patterns, and sometimes more advanced strategies. The advantage here is that these sites are regularly updated, ensuring you get current market insights and consistent explanations.
For instance, Investopedia’s candlestick guide includes clear illustrations and real-market examples, making it easier to visualise how patterns behave. Plus, because these PDFs come from established sources, you can feel confident that the info is vetted and accurate.
Most sophisticated trading platforms like MetaTrader, ThinkorSwim, and South African favourites such as EasyEquities provide educational sections with downloadable PDFs. These materials tailor candlestick patterns to the platform’s toolset, helping users apply the theory directly in their trading environment.
EasyEquities, for example, offers guides that explain pattern recognition alongside their charting tools, making it practical for traders keen to test strategies in real time. Accessing these PDFs through your trading platform can also integrate well with demo accounts, allowing hands-on learning without risking capital.
Having PDFs saved on your device means you can study candlestick patterns anywhere—even without internet access. This convenience is handy when you’re commuting or moving between areas with spotty mobile coverage. PDFs also let you highlight important sections or add notes, making your study sessions more interactive.
Besides study, these guides serve as quick references during the trading day. Say you spot an unfamiliar pattern—rather than scrambling online for explanations, you can flip through your PDF folder and pinpoint answers immediately, saving precious time.
Many PDF resources come with printable charts and example patterns, which you can pin up near your trading station or carry around. This hands-on approach helps reinforce what you’ve learned by offering constant visual cues.
Printouts are especially beneficial when teaching others or discussing strategies in trading groups or clubs. They make it easier to compare notes and explain complex setups without relying on screens, often enhancing retention and understanding.
Keeping a well-organised collection of candlestick pattern PDFs equips you with reliable and accessible tools, bolstering confidence and precision in your trading decisions.
Mastering candlestick chart patterns takes more than just recognising shapes on a screen. Regular practice sharpens your eye for detail and builds confidence in decision-making. Equally, avoiding common pitfalls helps you stick to sound trading habits instead of chasing misleading signals. Let's explore some practical tips that can help you become savvier with these patterns.
Demo accounts provide a risk-free environment where you can put your candlestick pattern knowledge to the test. For example, when you spot a hammer or engulfing pattern, you can practise entering and exiting trades without risking real cash. This hands-on approach helps you understand how patterns perform in real-time market conditions and what adjustments you might need.
The value lies in repetitive exposure and immediate feedback. If a pattern fails or performs as expected, you gain practical insight that no textbook can offer. Demo trading also allows you to combine candlestick patterns with other tools like moving averages or RSI (Relative Strength Index), which is key before risking real money.
Candlestick patterns don't behave the same across all markets. A bullish engulfing in a strong uptrend might be a solid entry signal, but the same pattern during sideways movement could quickly fizzle out. Keeping track of how patterns act during volatile times, quiet periods, and during news events helps you adjust your expectations.
By noting the performance of patterns in bullish, bearish, and neutral phases, you can develop a sense for when they are reliable and when caution is needed. This practice is particularly useful when market behaviour changes suddenly, say after a SARB interest rate decision or during load shedding periods that can affect trading volumes.
Putting all your faith in one candlestick pattern can be risky. For instance, seeing a doji alone doesn't guarantee a reversal; context matters. Traders sometimes jump the gun on a single signal without checking other confirmations like volume spikes or support/resistance levels, leading to costly mistakes.
It’s wiser to treat each pattern as a clue rather than a decisive verdict. Combine patterns with trend lines, indicators, or fundamentals before making a move. This layered approach reduces false signals and improves your chance of success.
Candlestick patterns show micro-level price action, but ignoring the bigger picture can trip you up. If the overall market is bearish but you spot a bullish pattern, the signal might be weak or temporary. Consider economic news, sector performance, and global factors alongside candlestick signals.
For example, during periods of high volatility caused by political uncertainty or unexpected Eskom load shedding, patterns may be less reliable. Keeping an eye on these influences helps filter out noise and focus on meaningful trading setups.
Practical mastery means combining solid pattern recognition with a broad understanding of market forces. This balanced attitude keeps your trading grounded and adaptable.
In short, consistently practising with demo accounts and observing patterns across different conditions builds reliable skills. Meanwhile, avoiding blind trust in single signals and considering wider market factors will keep your trading sharp and less prone to mishaps.
🔍 Learn how to spot hammer candlestick patterns and use them in trading for better market reversal insights. Practical tips for clear, effective analysis.
Explore how WWW binary works in web tech 🌐. Learn about data formats, practical uses, security, and optimisation for sharper web development insights.
📈 Master high profit candlestick patterns for smarter trading! Learn to spot signals, avoid errors, apply risk management & boost your strategy. 📊
📈 Learn how forex trading signals work, where to find them, and tips to spot reliable ones so you can trade smarter and boost your success in the market.
Based on 13 reviews