
Understanding Halal Forex Trading Principles
Explore how halal forex trading aligns with Islamic finance principles📈. Learn effective methods, ethical rules, broker tips, and practical advice for Muslim traders.
Edited By
Amelia Turner
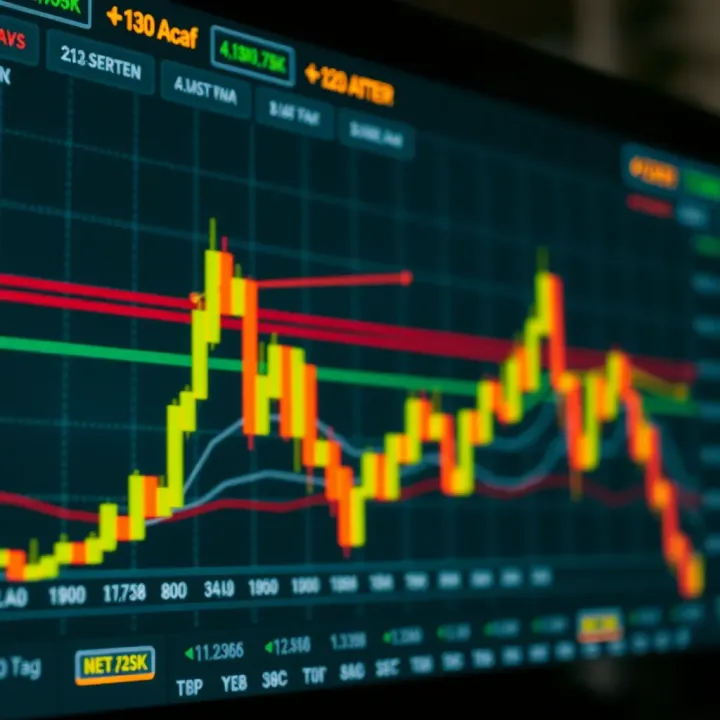
Candlestick patterns form the backbone of technical analysis in forex trading. They provide a visual representation of price movements within a specified period and can show traders where the market might head next. Unlike simple line charts, candlesticks display four crucial prices: the open, high, low, and close, giving a fuller picture of market sentiment.
Each candlestick consists of a body and wicks (also called shadows), which reflect the price range during that interval. If the closing price is higher than the opening price, the body is typically coloured green or white, signalling bullish momentum. Conversely, a red or black body means the price dropped, showing bearish pressure. These basic elements combine into patterns that traders use to anticipate reversals or continuation of trends.
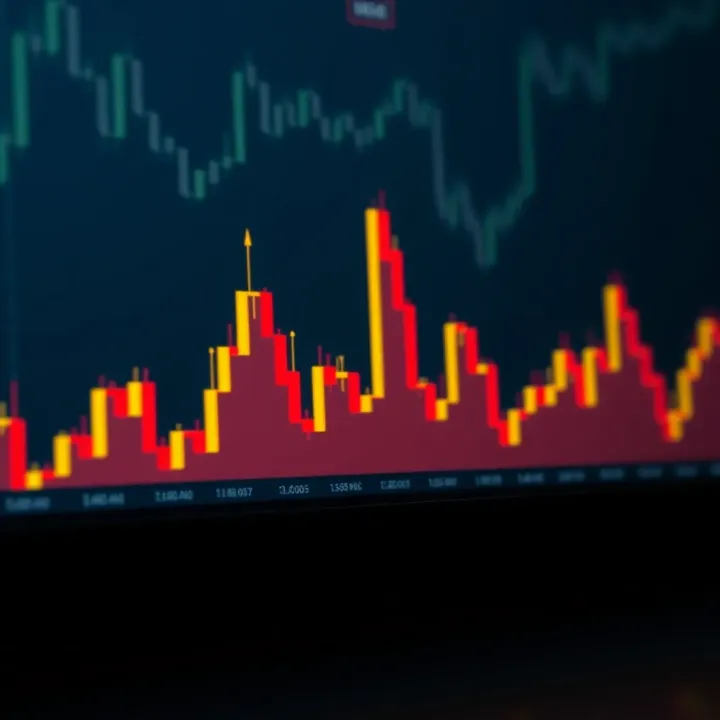
Reading candlestick patterns effectively means spotting opportunities early—whether it’s catching an upcoming rally or avoiding a sudden downturn.
Common patterns include the Doji, where the opening and closing prices are nearly the same, signalling indecision in the market. Another key pattern is the Engulfing pattern, where a single candlestick fully engulfs the previous one, often indicating a strong reversal. Patterns like the Hammer or Shooting Star suggest potential turning points, especially when found near support or resistance levels.
To apply these patterns confidently in real trading, context matters. For instance, a Hammer following a downtrend and forming near a known support zone may hint at a bullish reversal. But relying on patterns alone can be risky; combining them with other tools such as volume analysis or moving averages improves accuracy.
Trading platforms like MetaTrader or TradingView provide tools to view candlestick charts in real-time, suitable for South African traders managing forex positions amid market shifts or the occasional Eskom-induced volatility.
Mastering candlestick patterns helps traders read market mood with greater precision, improving decision-making and risk management. These patterns are not about guaranteeing outcomes but about stacking the odds a bit more in your favour when navigating forex markets.
Candlestick charts are a fundamental tool in forex trading, offering a clear visual of price movements within a specific time frame. Unlike basic line charts, candlesticks provide detailed information about the open, close, high, and low prices, which helps traders spot patterns and make more informed decisions. In the fast-moving world of forex, where prices can twist and turn quickly, these charts make it easier to grasp market sentiment at a glance.
Opening and closing prices are the backbone of a candlestick. They represent where the price started and ended during the chosen time interval—be it a minute, an hour, or a day. For example, if the opening price is lower than the closing price, the candle is typically coloured green or white, signalling bullish activity where buyers controlled the market. Conversely, if the price closes lower than it opened, the candle might be red or black, indicating bearish pressure. Spotting these shifts can help you identify when buyers or sellers are gaining influence.
High and low points mark the extremes reached during the period and appear as thin lines or 'wicks' above and below the candle's body. These highs and lows reveal volatility and market testing ranges. If a candle has a long upper wick, it suggests that sellers pushed the price back down after buyers tried to push it higher. Similarly, a long lower wick might indicate buyers stepping in after price dips. This insight can prove useful when assessing market strength or potential reversals.
The body and wicks explained give structure to the candle. The body shows the difference between the opening and closing prices and reflects the strength of the move in that period. A thick, long body means a significant price change with momentum, whereas a small body suggests indecision or consolidation. The wicks represent the price extremes outside the open and close. For instance, during a session with a strong uptrend, tiny upper wicks could indicate sustained buying, while long wicks may warn of resistance or price rejection.
A comparison with line and bar charts shows why candlesticks have gained popularity. Line charts connect closing prices over time, painting a straightforward trend line but lacking detail about intra-period movements. Bar charts provide more information—showing the open, high, low, and close prices—but their visual can be less intuitive for quick reads. Candlestick charts combine the detailed data of bar charts with a cleaner, more visually appealing style that highlights buyer and seller sentiment directly.
Why candlesticks are popular among traders comes down to clarity and real-time insight. They make it easier to spot key patterns, such as reversals or continuations, which are often missed on simpler charts. For instance, a series of small-bodied candles with long wicks might immediately warn you of a market standoff, prompting you to wait before entering a trade. Their visual nature speeds up decision-making, which is critical when trading volatile forex pairs where timing matters.
Candlestick charts go beyond numbers—they tell a story of market psychology in every session, making them a favoured chart type among savvy forex traders.
Understanding these basics lays the groundwork for reading more complex candlestick patterns and applying them effectively in your forex strategy.
Recognising key candlestick patterns helps forex traders spot potential market moves early. These patterns act like signals, showing whether a trend might reverse or continue, so traders can make better calls on when to enter or exit trades. Understanding the nuances of these patterns is vital for anyone serious about forex trading.
The hammer and hanging man are classic reversal patterns often spotted at market turning points. A hammer appears after a downtrend and suggests a possible bullish reversal. Its small body sits at the top of the candle’s range, with a long lower wick showing sellers tried to push prices down but buyers fought back. For example, if the EUR/USD pair forms a hammer at a known support level, this may hint at buying pressure picking up.
On the flip side, a hanging man shows up after an uptrend, signalling a possible bearish turn. Its shape resembles a hammer but occurs at the peak of a rally. Traders should watch for confirmation—such as a lower close following the hanging man—before acting to avoid premature decisions.
Engulfing patterns are powerful reversal signals when one candlestick completely covers the previous one’s body. A bullish engulfing pattern occurs when a small red candle is followed by a large green candle that ‘engulfs’ it, signalling that buyers have taken control. This could signal a shift in momentum, say in the GBP/ZAR market, encouraging traders to consider long positions.
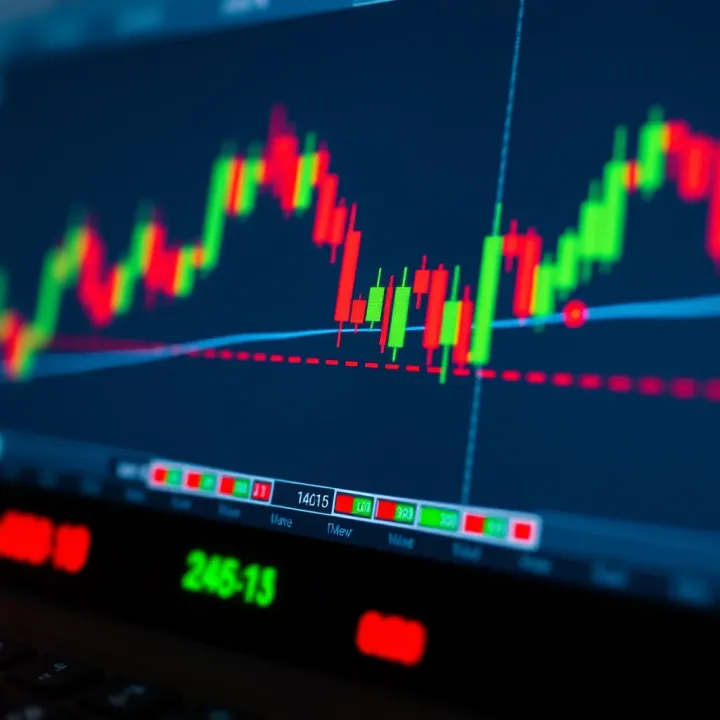
Conversely, a bearish engulfing pattern happens when a small green candle is swallowed up by a larger red one, indicating sellers stepping in strongly and a potential drop ahead. The real value here is recognising the shift in control between buyers and sellers.
Doji variations show indecision in the market, where opening and closing prices are almost the same. Dojis at key levels suggest a tug-of-war is underway between bulls and bears. For instance, a doji after a strong price rise in USD/JPY could warn that the uptrend is losing steam. Traders watch for follow-up candles to confirm the next move, preventing false signals.
The rising and falling three methods patterns signal when a trend is likely to keep going. In a rising three methods, a large bullish candle is followed by several small bearish candles that stay within the first candle’s range, then another strong bullish candle confirms the uptrend continues. This pattern shows brief profit-taking without trend reversal.
Similarly, the falling three methods is the opposite: a strong bearish candle, a cluster of smaller bullish candles within the first candle’s range, followed by another bearish candle extending the downtrend. Spotting these in action, like on the USD/ZAR chart during a sharp move, can help traders hold their positions more confidently rather than jumping out too soon.
Marubozu candles have no shadows or wicks and often indicate strong conviction. A green marubozu means buyers kept control from open to close, suggesting strong upward momentum. Conversely, a red marubozu shows sellers dominated. When you see a marubozu at trend starts or breaks, it often means a decisive move is underway, providing clues to traders where momentum lies.
Recognising these key candlestick patterns lets traders decipher market psychology and make better-informed decisions, rather than guessing. Mastering them is a step towards more disciplined and confident forex trading.
Candlestick patterns rarely tell the full story on their own. Their true strength lies in how they fit with the broader market picture. Interpreting these patterns in context — by combining them with other technical tools and price action cues — helps you separate valuable signals from misleading noise. This approach can prevent you from chasing false hopes or exiting trades prematurely.
Identifying key price levels is one of the first steps in contextualising candlestick patterns. Support and resistance represent price zones where the market historically hesitates, often reversing or consolidating. Recognising these levels on forex charts sets the stage for better pattern reading. For instance, a hammer candle forming near a strong support level hints at a possible bounce, whereas the same pattern in the middle of a trend might not hold as much weight.
Traders should look at daily or weekly charts for these levels, as short-term fluctuations tend to mask important price zones. A EUR/USD pair repeatedly bouncing off 1.0800 could signal a solid support area. If a bullish engulfing pattern appears around this level, it strengthens the case for a potential reversal or rally.
Confirming trend reversals requires more than spotting a single candlestick shape. Pairing reversal patterns with support or resistance levels boosts confidence in the signal. For example, a hanging man at a resistance zone following an uptrend suggests selling pressure could be kicking in. Confirmation usually comes from subsequent candles closing below the pattern’s low, indicating that sellers have gained control.
In practice, this means waiting for the next candle or two before acting, rather than jumping in at the first sign. This patience reduces impulsive trades based on weak signals, particularly relevant in the often volatile forex market.
Moving averages (MAs) help smooth out price action and highlight trends. When a candlestick pattern appears near a key MA, such as the 50-day or 200-day, it adds another layer of information. For example, a bullish engulfing candle forming above the 200-day MA may indicate that buyers still control the longer-term trend, making any reversal more credible.
Traders often use crossover points or the distance of price from an MA to gauge momentum. A doji at a moving average during a pullback hints that the pause might soon end, signalling a good entry point aligned with the broader trend.
Relative Strength Index (RSI) measures momentum by comparing recent gains to losses, indicating if a currency pair is overbought or oversold. When an oversold RSI reading accompanies a bullish candlestick pattern near a support level, it can confirm a buying opportunity. Conversely, an overbought RSI near resistance combined with a bearish pattern can warn of a pullback.
Say the GBP/ZAR dips toward a support zone with RSI around 30 (considered oversold), then forms a hammer candle. This confluence significantly improves the chance of a meaningful rebound.
Volume analysis offers insight into the strength behind price moves. High volume on a reversal pattern solidifies the signal; it shows that more traders agree with the turning point. Conversely, a pattern on low volume might be less reliable.
For example, if an engulfing pattern forms on the USD/ZAR chart with a notable spike in volume, it indicates robust buying interest supporting the reversal. Without this volume, the move could just be temporary noise.
Combining candlestick patterns with support and resistance, moving averages, RSI, and volume brings clarity to your analysis. It’s this blend of signals that makes trading in forex less guesswork and more calculated decision-making.
Trading forex using candlestick patterns calls for more than just spotting shapes on a chart; it demands a practical approach that helps you make smarter, less risky decisions. These patterns offer clues about potential market moves, but they aren't foolproof signals. To trade effectively, you need to avoid common pitfalls and implement sound risk management strategies that protect your capital while enhancing potential gains.
One of the biggest mistakes is treating candlestick patterns as standalone triggers without factoring in the broader trend. For instance, a hammer pattern might suggest a bullish reversal, but spotting it in the middle of a strong downtrend without confirmation can lead to a trap. Trends provide essential background—patterns that appear in line with the trend tend to be more reliable. Traders often lose money by jumping into trades based on patterns that clash with the general price direction.
To avoid this, always take a step back and check where the market is headed before acting on any pattern. For example, in an uptrend, a bullish engulfing pattern has more weight than if it appeared during a sideways market. Supporting your readings with trend analysis can save you from premature entries and false signals.
Another common error is putting too much faith in a single candlestick or pattern without seeking further confirmation. Markets are complex and can be spooked by random moves—one doji or hammer doesn’t guarantee a sustained reversal. Relying solely on that one signal can lead to whipsaws and losses.
Successful traders look for a combination of factors: a meaningful pattern supported by volume, alignment with support/resistance levels, or confirmation from technical indicators like moving averages. For example, a morning star pattern near a key support level, combined with rising RSI, offers a stronger case than the pattern alone.
Risk management starts with knowing where to place your stop-loss orders. Candlestick patterns can help identify logical exit points. For example, after entering a trade based on a bullish engulfing candle, setting the stop-loss just below the pattern’s low helps limit your losses if the market reverses unexpectedly. This approach keeps your risk defined and prevents small mistakes from turning into account-busting moves.
Without proper stops, any trade based on candlesticks becomes a gamble. The goal is to accept small losses quickly rather than hoping the market will turn in your favour.
Equally important is controlling the amount you risk per trade. Position sizing considers your total capital and risk tolerance to determine how much of the currency you can buy or sell. For example, if you decide to risk 1% of your R50,000 trading account on a setup confirmed by a candlestick pattern, you calculate your stop-loss size first, then adjust the lot size accordingly.
Balancing position size with stop-loss distance means you can stick to your plan without facing emotional pressure. It’s a simple guardrail that prevents chasing losses or overexposing yourself to the market’s swings.
Applying practical tips like avoiding common errors and managing risk carefully makes candlestick trading far more effective. It’s about working with the market, not against it, while protecting your capital every step of the way.
Candlestick patterns can offer valuable insights into forex market movements, but they aren’t foolproof. Traders need to understand their limitations to avoid costly mistakes. For example, relying solely on a hammer or engulfing pattern during volatile market conditions might lead to false conclusions. Recognising these limits helps traders approach patterns with healthy scepticism and sharpen their overall strategy.
Recognising unreliable patterns is key in forex trading because prices constantly fluctuate with what’s sometimes just random noise rather than genuine signals. Consider a doji forming in the middle of a sideways market—this might not indicate an imminent reversal but simply market indecision with no clear trend. Patterns that show up during low liquidity periods, like late in the US trading session or around public holidays, often lack strength and can mislead traders about the true market direction.
Using examples, a shooting star at the summit of a strong uptrend should be treated carefully—if volume is thin or momentum indicators don’t confirm, the signal might be unreliable. Ignoring such context leads to jumping the gun and taking positions prematurely.
Using confirmation tools is vital to filter out false signals. Indicators like the Relative Strength Index (RSI), Moving Averages (MA), and volume trends verify candlestick patterns. For instance, spotting a bullish engulfing candle at a support level gains weight if the RSI is oversold, signalling potential upward momentum. Without this confirmation, the pattern alone doesn’t offer a solid trading edge.
Similarly, traders often use pattern clusters—for example, a bullish morning star paired with a break above a 50-day MA—to strengthen confidence. Those extra layers help avoid whipsaws caused by market noise and improve timing.
Learning through demo trading can’t be overstated when working with candlestick patterns. It lets traders spot real-time patterns without risking capital, providing firsthand experience with their nuances and limitations. Running a demo account over several market cycles familiarises traders with how patterns behave under different conditions, such as trending markets versus choppy consolidations.
This practical exposure helps build pattern recognition skills beyond textbook diagrams, revealing how human emotion, global events, or unexpected price spikes affect output. Traders often discover that patience and context are just as important as spotting a perfect pattern.
Continuous pattern study is equally important because forex markets evolve with shifting liquidity, news flows, and trader behaviour. What worked last year might struggle now. Top traders stay sharp by revisiting classic patterns, examining fresh case studies, and adjusting their criteria based on recent market action.
Additionally, studying patterns in various currency pairs and timeframes broadens understanding. A pin bar on the EUR/USD daily chart carries different weight than the same pattern on a 15-minute chart of the rand-dollar. Ongoing learning sharpens intuition, helping traders sift signal from noise with better judgement.
In short, while candlestick patterns provide useful clues, combining them with confirmation tools and steady practice makes the difference between guesswork and informed trading decisions. This balance is essential to manage risks effectively and thrive in the forex markets.
Explore how halal forex trading aligns with Islamic finance principles📈. Learn effective methods, ethical rules, broker tips, and practical advice for Muslim traders.
📈 Master high profit candlestick patterns for smarter trading! Learn to spot signals, avoid errors, apply risk management & boost your strategy. 📊

🔍 Learn how to spot hammer candlestick patterns and use them in trading for better market reversal insights. Practical tips for clear, effective analysis.
📈 Learn how forex trading signals work, where to find them, and tips to spot reliable ones so you can trade smarter and boost your success in the market.
Based on 8 reviews