

Understanding Halal Forex Trading Principles
Explore how halal forex trading aligns with Islamic finance principles📈. Learn effective methods, ethical rules, broker tips, and practical advice for Muslim traders.
Edited By
Charlotte Hughes
Forex trading indicators are essential tools that help traders and analysts make sense of the often chaotic currency markets. Rather than relying on hunches or guesswork, these indicators provide a more systematic way to evaluate price movements, spot trends, and anticipate possible reversals.
Not every indicator suits every trader or market condition, especially within South Africa where factors like Eskom loadshedding and unique economic shifts can influence forex behaviour. Understanding how these tools work and how to pick the right combination can really improve your chances of making smarter decisions.
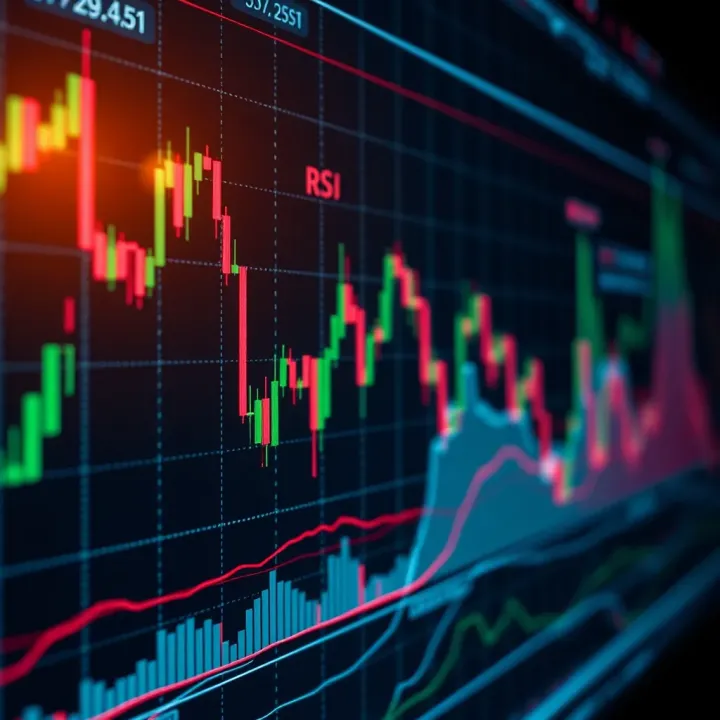
Indicators fall broadly into two categories:
Leading indicators: They attempt to predict future price action, giving signals ahead of potential moves. Examples include the Relative Strength Index (RSI) and Stochastic Oscillator.
Lagging indicators: These confirm trends or patterns after the fact, such as Moving Averages and the Moving Average Convergence Divergence (MACD).
While each indicator draws from price, volume, or occasionally other market data, using just one can lead to mixed results. For instance, the RSI might signal 'overbought', but that doesn't guarantee an immediate downturn; it could persist in an uptrend for some time. Combining indicators helps balance this out.
Relying solely on a single tool is like trying to read the weather from a single cloud—broader perspective matters.
Practical use of forex indicators involves:
Setting appropriate timeframes aligned with your trading style—scalpers focus on minutes, swing traders on hours or days.
Matching indicators to market conditions—trending or ranging markets call for different approaches.
Avoiding overloading charts with too many indicators, which muddies your view more than it helps.
In South Africa, factors like the Rand’s sensitivity to commodity prices or local interest rate changes mean that indicators should be adapted accordingly. Staying aware of macroeconomic news is just as important as watching technical signals.
Knowing what indicators do, how they behave, and their limitations is the first step to trading forex with more confidence and less guesswork.
Forex trading indicators are essential tools used by traders to interpret the complex movements in currency markets. These indicators crunch raw market data and present it in a way that helps traders spot patterns and signals without wading through endless charts and figures. Understanding how these tools work can make the difference between just guessing and making smarter market decisions.
In forex trading, technical indicators are calculations based on price, volume, or open interest data. They aim to summarise underlying market conditions in straightforward graphs or numbers. For example, a moving average smooths out price fluctuations to show the overall direction—or trend—of a currency's value. These tools don’t predict the future with certainty, but they provide clues about potential price action and market momentum. For traders in South Africa, where the rand can be quite volatile, indicators help manage risk by signalling entry and exit points more clearly.
Market data can be overwhelming with constant price changes every second. Indicators act like filters, condensing vast amounts of information into digestible visuals. Instead of staring at live tick charts, you might use a Relative Strength Index (RSI) to instantly see whether a currency is overbought or oversold. This simplification helps traders make faster decisions, especially during hectic trading sessions in the JSE or global forex markets.
One of the fundamental types of data indicators focus solely on price action—how the price of a currency pair has moved over time. Indicators like moving averages or price channels track this to show trends and reversals. For example, a trader might notice that the 50-day moving average crosses above the 200-day moving average, signaling a potential upward trend (known as a ‘golden cross’). Such signals help traders decide when to buy or sell, especially in fast-changing local conditions.
Some indicators measure the strength behind price movements by analysing volume (the number of trades) and momentum (the speed of price changes). The On-Balance Volume (OBV) indicator, for instance, combines price and volume to detect buying or selling pressure. Momentum indicators like the Stochastic Oscillator or RSI reveal if a trend is likely to keep going or fade. These insights let traders spot strong moves early, avoiding false signals common in choppy markets.
Indicators in this category gauge how much prices swing within a timeframe (volatility) and whether a market is trending or ranging. Bollinger Bands, which expand and contract around the price, show volatility shifts—wider bands mean more price chaos, narrower bands signal calm. The Average Directional Index (ADX) quantifies trend strength without showing direction. For South African traders, recognising volatility is key, given sudden rand fluctuations often linked to economic announcements or loadshedding interruptions.

Forex trading indicators are like tools in a mechanic’s kit: each has a distinct purpose to help you ‘fix’ your strategy and make smarter trades.
By understanding what each indicator analyses, traders get a clearer picture of the market’s current state, turning guesswork into informed decision-making. Whether focusing on price moves, market energy, or price turbulence, these insights empower better timing and risk management in forex trading.
Forex traders rely on popular trading indicators to break down complex market data into manageable insights. These tools guide decisions by highlighting trends, momentum, and price volatility — key factors that affect forex pairs like USD/ZAR or EUR/USD. Knowing how to interpret these indicators can help South African traders avoid unnecessary risks and spot practical entry or exit points.
Moving Averages (MA) simplify price data by smoothing out fluctuations over a set period. For example, a 50-day MA calculates the average closing price for the last 50 days, helping to identify the general direction of a currency pair. If the MA slopes upwards, it suggests an uptrend; if it tilts downwards, a downtrend. Traders often watch for "crossovers" where a short-term MA crosses above or below a long-term MA, signalling potential buy or sell moments. In volatile markets such as the ZAR affected by commodity price shifts, MAs can reduce noise and highlight the underlying trend.
Average Directional Index (ADX) measures the strength of a trend without indicating its direction. The ADX scale runs from 0 to 100, with readings above 25 signalling a strong trend, while below 20 suggests a weak or sideways market. It's useful for confirming whether existing price moves are likely to continue. For instance, during periods of economic uncertainty in South Africa, ADX can help traders decide if momentum is enough to hold positions or if a sideways-backing market advises caution.
Relative Strength Index (RSI) gauges the speed and change of price movements on a scale of 0 to 100. An RSI above 70 generally means a currency pair is overbought and may correct downwards; below 30 indicates oversold conditions ripe for a bounce. This indicator assists traders in timing entries and exits, especially in fluctuating pairs like GBP/ZAR. However, the RSI can remain overbought or oversold during strong trends, so it’s best paired with trend-following tools.
Stochastic Oscillator compares a currency's closing price to its price range over a specific period, typically 14 days. The resulting value, from 0 to 100, helps spot potential reversals — values above 80 indicate overbought conditions, while below 20 signals oversold. South African traders often use it alongside RSI to validate momentum shifts or identify false signals during range-bound markets.
Bollinger Bands consist of a moving average with upper and lower bands set at standard deviations above and below. This dynamic range expands and contracts with market volatility. When price touches or crosses the bands’ edges, it hints that the pair could reverse or continue its current trend. For example, if USD/ZAR breaks above the upper band after loadshedding impacts the rand, traders might expect either a continuation of volatility or a reversal. Bollinger Bands help keep an eye on changing market conditions.
Average True Range (ATR) measures average price volatility over a given period, showing how much a currency typically moves. A rising ATR points to increasing volatility, which could signal upcoming market shifts or riskier trading conditions. South African traders can use ATR to set stop-loss levels — a wider ATR suggests allowing more margin for natural price swings, limiting premature exits.
Popular forex indicators each reveal a different angle of market behaviour. Using them wisely helps traders form a clearer picture, make better calls, and manage risks smartly in South Africa’s dynamic forex environment.
Forex indicators can sharpen your trading decisions, but only if you use them thoughtfully. Knowing how to combine, interpret, and avoid common pitfalls with these tools can help you read the market better and reduce costly errors. This section breaks down practical ways to make the most of indicators and stay on the right track.
Relying on just one forex indicator can give a one-sided picture, often leading to false signals. For example, a moving average might show an upward trend, but if you don’t look at momentum indicators, you might miss signs of weakening strength. This can cause you to hold a position too long or enter at the wrong time. The market’s nature is complex, and one tool alone rarely captures its full behaviour.
Using multiple indicators together helps confirm signals and reduce noise. A common combo is pairing the Relative Strength Index (RSI), which measures momentum, with Bollinger Bands that indicate volatility. If the RSI shows oversold conditions while the price hits the lower Bollinger Band, it could be a stronger buy signal than either alone. Another example is using a moving average crossover alongside the Average Directional Index (ADX) to check trend strength before taking a position. These complementary tools cross-check each other, improving your chances of spotting reliable opportunities.
One trap traders often fall into is cluttering their charts with too many indicators. Overloading can make your chart look like a jumble, causing confusion rather than clarity. Plus, many indicators can give conflicting signals, which adds to hesitation and doubt. A good rule of thumb is to keep it simple—two or three well-chosen indicators that serve distinct purposes usually work best.
Misinterpreting indicators is another risk. For instance, the RSI hitting overbought territory doesn’t always mean the price will immediately fall; it can stay overbought for some time during a strong trend. Mistaking this for a reversal and exiting early could cost profits. To avoid this, watch out for signals in context and wait for confirmation signals. Practice reading charts with demo accounts can help you recognise the difference between genuine signals and noise.
Combining indicators thoughtfully and avoiding chart clutter improves your decision-making. Equally, understanding exactly how indicators behave in different market conditions keeps your trades sharper and less emotional.
By applying these practical steps, you stand a better chance of using forex indicators effectively and trading smarter, not harder.
Adapting forex indicator strategies to South African conditions helps traders make smarter choices amid local economic twists. The rand’s characteristic volatility, combined with unique economic factors and available trading platforms, demands a tailored approach. Simply importing strategies from global markets without adjustments often leads to misreads and losses.
The South African rand (ZAR) frequently experiences swings driven by global commodity prices, political developments, and domestic policy shifts. Unlike more stable currencies, these fluctuations can amplify risks but also offer trading chances for those who understand the rand’s behaviour.
For instance, when the SARB (South African Reserve Bank) changes interest rates, the rand often reacts sharply. Traders using indicators like ATR (Average True Range) to gauge volatility must adjust settings to capture these local spikes accurately. Ignoring rand-specific volatility could cause mistimed trades or missed opportunities.
South Africa’s reliance on commodities such as gold and platinum means that forex traders should monitor commodity trends alongside currency charts. A weakening rand often correlates with falling commodity prices and vice versa. Combining forex indicators with fundamental cues, like commodity indices or global demand signals, can offer more reliable entry and exit points.
Moreover, Eskom’s ongoing loadshedding and periods of economic uncertainty can influence market sentiment. Traders might opt to focus on shorter timeframes or tighten stop-loss levels during these times to mitigate unexpected shocks. Tailoring strategies to factor in these economic realities improves risk management.
South African traders largely favour platforms like MetaTrader 4 and 5, Plus500, and IG Markets due to their local presence, regulatory compliance, and user-friendly interfaces. These platforms provide the familiar indicators discussed earlier, tailored with regional data feeds.
Local brokers often offer support in ZAR trading accounts, reducing forex conversion costs and making start-up easier for local traders. Some platforms also provide educational resources in English and Afrikaans to help traders get acquainted with indicator strategies.
Timely access to accurate data is vital for active forex trading. South African platforms typically offer real-time feeds, but traders should check for any lag, especially during volatile rand moves. Some platforms allow custom indicator plugins to reflect local market nuances, such as rand volatility-adjusted ATR or commodity-linked signals.
Additionally, integrating indicators with platforms like TradingView or Bloomberg Terminal (for advanced users) is possible, providing broader analytical tools. Having these tools on hand ensures that strategies can react instantly to market changes, which is crucial in the fast-moving forex environment.
Tailoring forex indicator strategies to South African realities—from the rand’s quirks to choosing the right platform—can make the difference between consistent trades and costly mistakes.
Crafting a solid trading strategy using forex indicators requires more than just theory. It involves rigorous building and testing to make sure your chosen tools truly work under various market conditions. Testing guards against costly mistakes and sharpens your ability to react intelligently to currency movements. For instance, a trader relying only on the RSI indicator might miss signals confirmed by moving averages, leading to false entries or exits.
Backtesting means running your strategy against historical price data to see how it would have performed in the past. This process helps traders understand which indicator combos produce reliable signals and which don’t. Take, for example, pairing Bollinger Bands with the Average True Range (ATR) indicator. Backtesting might reveal that this combo shines during volatile periods but struggles in sideways markets.
In a South African context, backtesting tools available locally include MetaTrader 4 and 5 (MT4/MT5), which most brokers support. These platforms offer built-in simulators to replay historical data, so you can spot weaknesses in your plan without risking real capital. Using historical Rand-Dollar (ZAR/USD) data can highlight how your strategy holds up against local currency swings influenced by domestic events.
Demo trading lets you test your strategy in real-time market conditions, but with virtual money. It removes the emotional stress of risking real funds while you practice executing trades based on indicator signals. For example, you might notice that your entry point triggered by the Moving Average convergence/divergence (MACD) indicator often coincides with short-term market surges, prompting you to adjust your stop-loss levels.
But demo trading is just the start. Adjusting your strategy based on ongoing results is key to success. If the indicators give frequent false positives, tweak the parameters or introduce additional tools that better capture local market quirks, like Rand volatility during times of political uncertainty. Over time, your trades will reflect sharper decision-making, boosting confidence and potentially lowering losses.
Testing is not a one-time chore but a continuous process. Each iteration helps refine your strategy, building resilience against ever-changing forex market rhythms.
By using backtesting and demo trading alongside careful adjustments, South African traders can better harness forex indicators to make smarter market choices, tailored to real-world conditions in Mzansi and beyond.
Explore how halal forex trading aligns with Islamic finance principles📈. Learn effective methods, ethical rules, broker tips, and practical advice for Muslim traders.
📈 Learn how forex trading signals work, where to find them, and tips to spot reliable ones so you can trade smarter and boost your success in the market.
📈 Understand forex trading systems: how they work, types used, testing, tweaking, and tips on risk management to fit your style and goals. 💹
📈 Explore forex trading in South Africa with a clear guide on currency markets, trading strategies, risks, and practical tips to help you trade smarter today.
Based on 13 reviews