

Understanding Halal Forex Trading Principles
Explore how halal forex trading aligns with Islamic finance principles📈. Learn effective methods, ethical rules, broker tips, and practical advice for Muslim traders.
Edited By
Charlotte Davies
Flags and pennants are popular continuation patterns in price charts that traders rely on to gauge where the market might head next. These formations appear during strong price trends, typically indicating a temporary pause before the previous move resumes. Recognising these patterns can sharpen your entry and exit timing, especially in volatile markets.
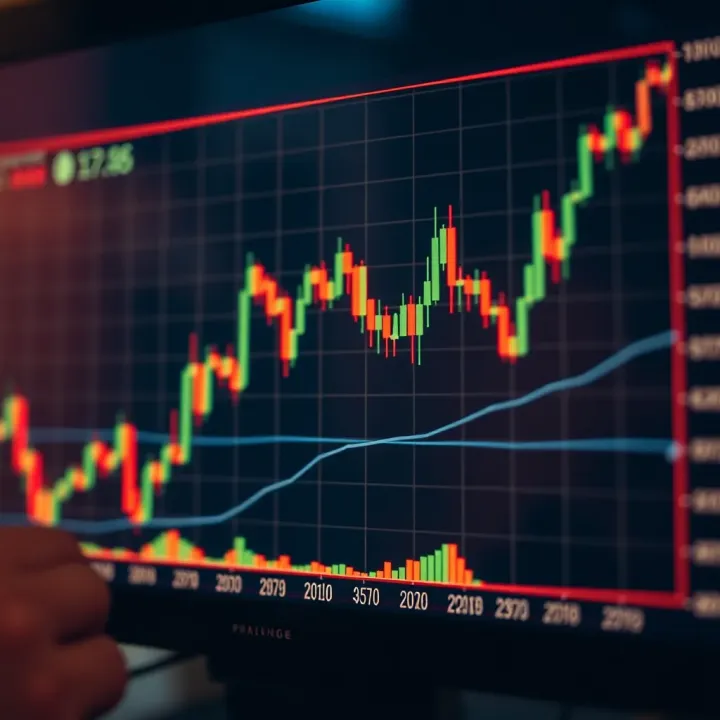
Flags look like small rectangles slanting against the prevailing trend. Imagine a flag fluttering on a pole; the pole represents the sharp price move, and the flag is the consolidation that follows. Pennants, on the other hand, resemble small symmetrical triangles formed by converging trendlines. Both suggest that after a quick burst in price, the market catches its breath before continuing in the same direction.
Flag Formation: After a steep rise (or fall), price trades sideways or slightly against the main trend with parallel trendlines. For instance, a share might sprint from R50 to R60, then hover between R58 and R61 forming a tight range before pushing higher.
Pennant Formation: Post a strong move, price enters a narrowing range where support and resistance trendlines converge. Picture the same share ticking between R58 and R61 but each bounce is smaller than the last, shaping a triangle.
They reflect market psychology. The initial sharp move shows strong buying or selling pressure. The flag or pennant phase signals hesitation or profit-taking among traders, but not a reversal signal. When price breaks out from these tight formations, it often signals that momentum is ready to surge again.
Being able to identify flags and pennants gives you an edge by confirming market sentiment and helping avoid premature trades during consolidations.
Confirm Volume: Volume typically declines during the formation and spikes on breakout. For example, watch out for volume surges when the price punches through the upper trendline.
Use Stop-Losses: Place stops just outside the opposite side of the pattern to guard against false breakouts.
Target Projection: Measure the initial sharp move ('flagpole') and project that from the breakout point to estimate potential price targets.
Timeframes Matter: Flags and pennants can appear on all timeframes, but longer periods tend to give more reliable signals.
Understanding these patterns means having one more tool to read the market’s rhythm — helpful whether you trade shares on the JSE, commodities like gold, or currency pairs in Forex. Keeping an eye on these formations, alongside other indicators and local market context, can improve your trading decisions and reduce guesswork.
Flags and pennants are go-to patterns for many traders looking to predict the continuation of a current market trend. Spotting these patterns early can provide a practical edge, helping you time entries and exits more effectively. Their value lies in signalling when a brief pause in price movement is likely to end, allowing the prevailing trend to resume. For instance, when a stock like Shoprite shows a strong upward move followed by a slight consolidation in a flag pattern, those watching closely can anticipate more gains when the price breaks out.
Understanding these patterns isn’t just for the pros; even casual investors benefit from recognising them. They offer a straightforward visual cue that's widely applicable across shares, forex, and commodities—even Bitcoin. Recognising a pennant or flag helps you avoid jumping in on a random pullback or mistaking a trend reversal, which could lead to losses.
Flags and pennants are both continuation chart patterns that appear after a sharp price move, often called the "flagpole". A flag resembles a small rectangle or parallelogram that slopes slightly against the trend, formed by parallel trendlines. A good example is MTN's share price showing a sharp rise, followed by prices moving sideways within a narrow, downward-sloping channel—that’s a typical flag.
A pennant, in contrast, looks like a small symmetrical triangle where trendlines converge. It forms when the price consolidates tightly after a steep rise or fall. Imagine Naspers' share price rising sharply, then moving within tightening upper and lower trendlines before breaking out—a classic pennant.
Both patterns suggest the market is taking a breather without losing the trend's direction. They reflect traders’ pauses to catch breath before pushing prices further in the original direction. This makes them useful for trend traders who want to stay on board rather than jump ship prematurely.
When the price breaks out of the flag or pennant, it often resumes moving in the same direction as before—up in an uptrend or down in a downtrend. Thus, these patterns act as signals confirming the strength of the ongoing trend.
Flags and pennants help traders confirm if a trend will likely continue. In volatile markets, trends can be jerky and unpredictable. Seeing a clear flag or pennant can cut through the noise, signalling a likely continuation rather than a reversal or random pullback.
For example, during the busiest trading day on the JSE, a flag pattern on Sasol shares can indicate that the recent upward momentum will persist, giving traders confidence to hold or add to positions.
Recognising these patterns amidst price fluctuations can mean spotting an opportunity before others catch on.
These patterns aren't limited to equities—they show up across forex pairs like USD/ZAR, commodities such as gold or platinum, and even cryptos traded on local or international exchanges. Their widespread occurrence means learning to spot them boosts your versatility as a trader, no matter your market.
In S&P 500 futures or even bonds, flags and pennants offer consistent clues about next moves. The patterns' reliability across markets and timeframes makes them a staple in many trading toolkits around Mzansi and beyond.
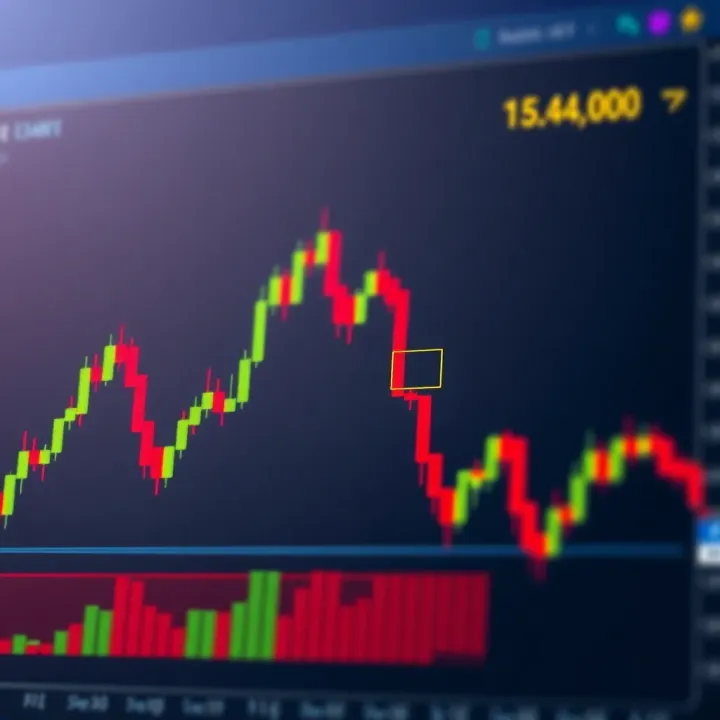
By getting familiar with these simple yet powerful shapes, you sharpen your ability to read charts and act decisively amidst the markets' shifting tides.
Recognising flags and pennants on price charts is a vital skill for traders looking to anticipate continuation moves after a pause in an existing trend. These patterns offer practical clues about market sentiment and potential breakouts, enabling you to time entries more precisely and manage risk better. For instance, spotting a flag pattern after a strong upward rally can signal the likelihood of another leg higher.
Shape and slope of the flag
Flag patterns generally form as small rectangles or parallelograms that slope against the prevailing trend. For example, in an uptrend, the flag often slopes downwards or moves sideways, resembling a gentle pullback. This contrary slope indicates a temporary pause where sellers gain a slight edge, but overall buyer control remains intact. Identifying this subtle slope matters because it confirms the flag's nature as a rest within a larger move rather than a reversal.
Typical duration and size
Flags tend to be short-term patterns that last from a few days to several weeks, depending on the timeframe you trade. Size-wise, the flag usually covers around one-third to one-half the length of the prior price move—the so-called flagpole. For example, if a stock surged 10% over a week, the flag might span a correction of 3–5% over a few sessions. Knowing this helps you calibrate expectations and avoid mistaking a longer consolidation for a flag.
Shape of the pennant
Pennants start as small symmetrical triangles that converge as price action tightens. Unlike flags, pennants lean neither up nor down but balance around a narrowing point. This shape reflects a market tug-of-war where neither buyers nor sellers hold firm dominance during a pause. Spotting a pennant suggests decreased volatility and a buildup of energy that typically resolves with a breakout in the direction of the prior trend.
Comparison with flag features
While both flags and pennants signal continuation, their shapes and slopes differ noticeably. Flags tend to remain rectangular with an opposing slope to the trend, whereas pennants are triangular and slope-neutral. The duration often overlaps, but pennants may appear slightly shorter or on faster timeframes. This distinction is practical because it informs your trade management; flags might allow wider stops due to their rectangle shape, whereas pennants call for tighter entries as breakouts occur nearer the apex.
Visual differences
Visually, flags resemble miniature trend channels or rectangles with parallel trendlines, while pennants narrow towards a point from both sides. For example, on a 1-hour chart of a local blue-chip share, a flag looks like a small bearish channel following a sharp rise, whereas a pennant is a tiny symmetrical triangle after the same rise. These visual cues matter when quickly scanning charts for setups.
Technical criteria traders use
Traders often confirm flags by identifying parallel or nearly parallel trendlines enclosing the price action, with a counter-trend slope. Pennants require converging trendlines that form a symmetrical triangle. Volume patterns also differ; flags may show declining volume during the consolidation, but pennants typically exhibit sharper volume contraction before a breakout. Applying these technical checks reduces the risk of misclassification and helps you decide where to place entries and stops.
Knowing how to identify and differentiate flags and pennants properly helps traders grasp the market’s temporary breathing phases and capitalise on the subsequent continuation moves effectively.
Understanding the psychology driving flags and pennants can give traders a clearer edge. These patterns aren’t just random price formations – they reflect the tug of war between buyers and sellers during a pause in a strong trend, offering clues about what may happen next.
A flag or pennant usually forms after a sharp price move, where traders take a breather before the next big push. This pause helps the market catch its breath; traders who rushed in earlier might take profits, while others wait for a more secure entry point. Think of it as traffic slowing down briefly before speeding up again.
For example, after a strong rally in a stock, the price may consolidate sideways or slightly retrace for a few days. This isn’t indecision but a healthy pause where the market balances recent gains against future potential. Recognising this pause helps traders avoid jumping in too early or missing the move.
During the formation of flags and pennants, there's a momentary equilibrium where buying pressure matches selling interest. Neither side dominates, and prices move within a narrowing range. This balancing act is the market digesting prior gains before deciding on the next direction.
In practice, you might notice volume drying up while the price oscillates in a tight channel. This lack of commitment reflects traders waiting for fresh information or confirmation. For traders, this means patience is key – the battle is on hold but far from decided.
Because flags and pennants appear after strong trends, they generally signal the trend is likely to continue once the pattern resolves. The pause is temporary, and traders anticipate a breakout in the same direction.
For instance, if a rand-based share surges higher and forms a flag, the expectation is a renewed rally on breakout. This expectation is why many traders watch these patterns closely; they offer a chance to join a proven trend with established momentum.
Volume typically declines during the flag or pennant formation as traders hesitate. Then, as the price breaks out, volume surges again, confirming the move.
This volume behaviour is a practical guide. Spotting low volume during consolidation and increased volume at breakout validates the signal. Without this volume pattern, the breakout might be questionable, so savvy traders keep a keen eye on volume as part of their strategy.
In summary, flags and pennants represent moments where the market pauses and balances prior gains before continuing the trend, with volume shifts providing key confirmation. Recognising the underlying psychology improves timing and confidence in trading decisions.
Trading flags and pennants effectively requires a clear strategy. These chart patterns are reliable signals for trend continuation when used properly. By understanding entry points, managing risk, and setting profit targets, traders can navigate markets more confidently and improve their timing. In practice, this means waiting for confirmation before jumping in, limiting losses with well-placed stop losses, and having realistic goals for exiting trades.
Confirmation signals are vital before entering a trade based on flags or pennants. Traders often look for a breakout—the price moving decisively beyond the pattern's boundary—supported by increased volume. For example, if a bullish flag forms during an uptrend, waiting for the price to break above the flag’s upper trendline with a spike in volume can reduce the risk of false entries. Other indicators like the Relative Strength Index (RSI) or moving averages can add confidence, confirming that momentum supports the breakout.
Setting entry points properly is essential to avoid premature or late entries. A common approach is to place a buy or sell order a few ticks above or below the breakout level. For instance, in a breakout of a pennant overhead resistance, placing a buy order slightly above the resistance ensures the breakout has real follow-through. This also helps prevent getting trapped by fake breakouts that briefly penetrate the pattern before reversing.
Typical stop loss locations tend to be just outside the opposite side of the pattern. If you enter a long trade after a bullish flag breakout, placing the stop loss just below the flag’s lower boundary can shield you from unexpected reversals while giving the trade enough room to breathe. This positioning balances protecting capital with avoiding getting stopped out from normal price fluctuations.
Position sizing considerations are equally important. Because flags and pennants often lead to quick price moves, traders should size positions so a stop loss loss translates to an acceptable risk amount—typically 1–2% of the trading capital. Adjusting position size depending on pattern size and volatility helps maintain control and prevents overexposure, especially in more volatile markets like forex or certain JSE counters.
Measuring pattern height provides a handy guideline for profit targets. The typical method involves measuring the length of the pole leading into the flag or pennant and projecting that distance from the breakout point. If a bullish flag's pole is 50 points long, an optimistic profit target would be roughly 50 points above the breakout level. This projection aligns with historical moves following these patterns.
Setting realistic profit objectives means not expecting every trade to hit the maximum target. Taking partial profits along the way or scaling out when momentum starts to fade can preserve gains and reduce stress. For instance, if a breakout triggers a fast move, booking some profits as the price nears the measured target avoids the disappointment of a reversal erasing gains.
Effective trading with flags and pennants combines patience, discipline, and clear rules. Waiting for confirmation, managing your risk carefully, and having a well-thought-out exit plan can turn these popular chart patterns into reliable tools rather than mere guesses on the charts.
This approach suits diverse traders in South Africa, from stockbrokers watching the JSE Top 40 to forex traders monitoring rand-dollar volatility.
Traders often trip up on flags and pennants because they don’t fully understand common pitfalls or how to strengthen their signals. This section looks at practical advice to help you use these patterns effectively and avoid costly missteps. Recognising false breakouts and confirming pattern validity are key to improving your trading outcomes with these setups.
A false breakout occurs when the price moves beyond the pattern boundary but fails to continue in the breakout direction. One red flag is when volume doesn’t pick up during the breakout. For example, during a bullish flag breakout, if volume dries up instead of rising, the move might lack conviction and could reverse quickly. Another warning sign is a breakout against the general trend or into strong support or resistance zones.
Rapid breakouts followed by a swift return inside the pattern are also suspicious. An example could be when price breaks above the flag pole height but closes back within the flag itself on the same day, indicating a lack of follow-through. Traders should be cautious with such moves, as they often trap impatient buyers.
Look for confirmation by waiting for a candlestick close beyond the pattern boundary rather than an intraday move alone. A solid close with increased volume is a stronger signal. Additionally, checking multiple timeframes can help confirm the breakout’s legitimacy—a breakout on a daily chart supported by increased volume and confirmation on a 4-hour chart adds confidence.
You can also combine flags and pennants with momentum indicators like the Relative Strength Index (RSI) or Moving Average Convergence Divergence (MACD). If these support the breakout direction by showing bullish or bearish momentum, the break is more likely genuine. For example, a rising RSI crossing above 50 during a pennant breakout supports an upward move.
Volume is a reliable companion when trading flags and pennants. Typically, volume contracts during the pattern’s formation—reflecting the pause—and then expands during the breakout. Lack of volume confirmation should raise doubts about the move’s strength.
Aside from volume, using simple moving averages (SMA) can help identify trend direction and provide dynamic support or resistance around the pattern. For instance, a flag forming above the 50-day SMA with price bouncing off it looks stronger than one forming below this key average. Indicators like Bollinger Bands can also highlight volatility compression or expansion, adding another layer of context.
Remember, flags and pennants are continuation patterns; they perform best when aligned with a clear, strong preceding trend. Spotting a flag in a choppy or sideways market increases the risk of failure. For example, in a clear uptrend on the JSE Top 40 index, flags generally present higher probability setups for upward continuation.
Always zoom out to check the broader market environment. A bullish flag within an overarching downtrend might be counter-trend and riskier to trade. Meanwhile, confirming the pattern’s position within daily, weekly, or even monthly charts can help avoid false signals and improve trade timing.
Wise use of flags and pennants blends price action, volume, trend context, and technical indicators. This layered approach reduces guesswork, helping traders focus on setups with true potential and steer clear of costly mistakes.
Explore how halal forex trading aligns with Islamic finance principles📈. Learn effective methods, ethical rules, broker tips, and practical advice for Muslim traders.
📈 Learn how forex trading signals work, where to find them, and tips to spot reliable ones so you can trade smarter and boost your success in the market.
📈 Understand forex trading systems: how they work, types used, testing, tweaking, and tips on risk management to fit your style and goals. 💹

📈 Explore forex trading in South Africa with a clear guide on currency markets, trading strategies, risks, and practical tips to help you trade smarter today.
Based on 5 reviews