

Effective Forex Trading Strategies That Work
Explore proven forex trading strategies tailored for traders in South Africa. Learn smart risk management and pick the right tools 📈💰 to trade effectively.
Edited By
James Harrison
Fibonacci tools are a staple in many forex traders' toolkits worldwide, including here in South Africa. The technique hinges on certain mathematical ratios—like 38.2%, 50%, and 61.8%—derived from the famous Fibonacci sequence. These ratios help traders spot places where market price might pause, retrace, or continue its trend, offering potential buying or selling opportunities.
In forex, prices rarely move in a straight line. They tend to zigzag with pauses and pullbacks. Using Fibonacci retracement levels, you can predict where these pullbacks might happen after a strong move. For instance, if the rand-dollar pair rushes upwards, traders often watch the 38.2% or 61.8% retracement level as potential entry points to join the trend.

Fibonacci extensions come into play when you’re looking beyond the usual pullbacks to project where the price might go next. These levels can indicate target prices for your trades or areas where the market might hit resistance or support. Say, after a bounce back from a retracement, the price might stretch out to the 138.2% extension level, signalling a possible place to lock in profits.
Use Fibonacci tools alongside other indicators like moving averages or RSI to confirm signals. Relying on Fibonacci alone can be risky, especially in volatile markets we see sometimes in Mzansi due to local economic news or global shifts.
Some practical tips for South African forex traders using Fibonacci:
Always draw retracements from the correct swing points. Pick clear, recent highs and lows for accuracy.
Combine Fibonacci with trend analysis. A bullish trend with retracement levels offers better long setups.
Mind the time frames. Fibonacci levels on a 4-hour chart differ from those on a daily chart; use what suits your trading style.
Watch for confluence. If Fibonacci lines line up with a known support level or a round number like R17.00, it’s a stronger signal.
Fibonacci tools are not foolproof but offer a structured way to read price action. Many savvy traders in Johannesburg and Cape Town use them to supplement their decision-making. By practicing proper risk management and avoiding common traps like chasing levels blindly, you can add them effectively to your forex strategy.
Grasping Fibonacci ratios is fundamental for traders looking to interpret price movements more effectively. These ratios help identify potential areas where a currency pair might reverse or continue its trend. For example, in the volatile EUR/USD pair, spotting a retracement to a Fibonacci level can signal a good entry point, reducing guesswork.
The Fibonacci sequence originates from medieval mathematics, discovered by Leonardo of Pisa, known as Fibonacci. Each number in the sequence is the sum of the two preceding numbers, producing ratios that surprisingly show up in nature and financial markets alike. Traders use these levels because they often mark points where market psychology causes prices to stall or turn, reflecting collective behaviour rather than random moves.
Retracement levels indicate potential pullbacks within a prevailing trend, helping traders find strategic entry points. Common retracement ratios include 23.6%, 38.2%, 50%, 61.8%, and 78.6%. For instance, after a steady uptrend in USD/ZAR, a pullback to the 61.8% level might offer a lower-risk opportunity to enter a long position anticipating the trend continuation.
Traders rely on these levels to anticipate where a correction may end before the original trend resumes. These levels create logical areas to place stop-loss orders just beyond, managing risk efficiently.
Extension levels allow traders to forecast how far a new move might push beyond a recent high or low. Typical extensions include 127.2%, 161.8%, and 261.8%. Take GBP/USD entering a strong uptrend: traders can use the 161.8% extension to set realistic profit targets rather than guessing arbitrarily.
Using extension levels to set profit targets helps prevent premature exits and maximises gains when the market moves in traders’ favour. Extensions are especially useful in trending markets where momentum tends to carry price beyond its previous boundaries.
Projection levels combine prior swing points to forecast potential future turning points, serving as a directional guide. Unlike retracements and extensions focused on price movement length, projections use geometric relationships between price swings to project where the market might find support or resistance next.
For example, a trader watching USD/JPY may use projection levels to estimate a zone where the price might halt after a sharp move. This guides better timing decisions for entry or scale-out strategies during volatile sessions.
Fibonacci levels often align with widely observed market psychology. Large groups of traders place orders near these points, which leads to self-fulfilling prophecies. Candlestick patterns or volume confirms at these levels add weight.
Understanding these ratios lets traders pinpoint entry and exit points with more confidence, improving timing and reducing emotional trading mistakes.
Recognising the interplay between Fibonacci levels and price action is crucial. These zones typically coincide with support and resistance areas, making them a valuable compass amid forex’s constant ebb and flow. Traders who integrate Fibonacci ratios thoughtfully tend to navigate market swings more calmly and efficiently.

Fibonacci retracement levels are essential tools for traders looking to find promising entry and exit points in forex markets. These levels highlight areas where the price is likely to pause or reverse, letting traders plan their moves with more confidence. When applied correctly, retracements can pinpoint where to buy or sell, improving timing and risk management.
To draw Fibonacci retracement levels, you first need to identify the recent significant swing high and swing low on a currency chart. The swing high is the highest point before a price pullback, and the swing low is the lowest point before a bounce. Choosing these points accurately is crucial because they frame the price movement that the retracement levels will measure.
For example, if you're analysing the USD/ZAR pair and spot a clear upward move from R14.50 to R15.20 before the price dips, you’d set your swing low at R14.50 and swing high at R15.20. Drawing retracement levels between these points helps reveal likely support zones where price might halt its decline.
The most commonly used Fibonacci retracement percentages are 23.6%, 38.2%, 50%, 61.8%, and 78.6%. Each represents how far the price has pulled back from the original move. The 38.2% and 61.8% levels are especially revered since they often coincide with strong support or resistance zones in reality.
If, for instance, EUR/USD rises from 1.1000 to 1.1200 and then drops, watch closely at these retracement levels for places price might reverse and continue upward. These percentages give traders objective points to set buy orders, stops, or target exits.
Moving averages help smooth out price data and indicate overall trend direction. When Fibonacci retracement levels align with key moving averages like the 50-day or 200-day, it adds weight to these zones as potential reversal points. For instance, if the GBP/USD price retraces to a 61.8% Fibonacci level near its 50-day moving average, this convergence increases the likelihood of a bounce.
Classic support and resistance levels gained from previous highs or lows complement Fibonacci retracements. If a Fibonacci level falls close to a prior support line, you get a stronger signal that buyers might enter there. Traders often spot clusters of such levels to confirm trade decisions.
Candlestick patterns like hammers, engulfing candles, or dojis appearing at Fibonacci retracement levels enhance the reliability of those levels. These patterns reflect market sentiment shifts and, combined with Fibonacci tools, give traders clearer signals for entries or exits. For example, spotting a bullish engulfing candlestick on a 50% retracement during a downtrend might prompt a buy.
Look at USD/ZAR during recent volatility; retracement levels have repeatedly marked zones where the rand found support or resistance. Integrating Fibonacci retracements with moving averages or candlestick confirmations has helped many traders time entries well, avoiding premature buys during brief pullbacks.
Similarly, EUR/USD often respects the 61.8% retracement level in short-term downswings, especially when a support zone overlaps.
Using Fibonacci retracements alongside other tools creates a more complete picture, improving the odds in what can otherwise be a noisy forex market.
In summary, Fibonacci retracement levels provide clear, objective points to guide buying and selling decisions. Highlighting key pullback zones and combining these with moving averages, historic support/resistance, and candlestick signals builds a robust strategy for entering and exiting trades in major currency pairs.
Fibonacci extension levels help traders forecast where a currency pair's price might reach following a retracement. Unlike retracement levels—which suggest where price may pull back before continuing a trend—extension levels project possible areas where price could stretch beyond its previous high or low. This makes them invaluable for setting informed profit targets in trending markets.
Retracement levels focus on pullbacks within an existing trend. For example, after a strong upward move in the EUR/USD, Fibonacci retracement levels help identify areas where the price might pause or reverse temporarily before resuming the uptrend. These levels typically include 23.6%, 38.2%, 50%, 61.8%, and 78.6%.
On the other hand, Fibonacci extension levels project beyond the original swing’s boundary, estimating where price could move once it breaks past the prior high or low. Common extension ratios include 127.2%, 161.8%, and 261.8%. Traders use these to map out practical profit targets, especially when riding strong trends without clear resistance nearby.
Fibonacci extension levels like 127.2% and 161.8% serve as natural take-profit markers. For instance, if USD/ZAR rallies from R14.00 to R15.00, then pulls back to R14.50, a trader might set a profit target around R15.27 (127.2% extension) or R15.62 (161.8% extension). These points often coincide with psychological levels or prior price congestion.
These extension points aren’t arbitrary; they reflect natural proportions found in price action and market psychology, making them useful for traders aiming to balance reward and risk without stretching targets unrealistically.
Market volatility and prevailing momentum affect how strictly you should trust Fibonacci extension targets. In choppy or sideways markets, price might stall before hitting higher extensions. In such cases, it’s wise to set closer targets or rely on additional indicators like volume or moving averages.
Conversely, during strong trending phases—as seen occasionally with GBP/USD amid geopolitical news—price might blast through the 161.8% extension and carry on. Here, traders can consider layering profit targets at multiple extensions or trail stops to lock in gains while allowing for further upside.
Take the case of the USD/JPY rally amid global risk-on sentiment. Traders who measured the swing from 130.50 to 135.00 and applied extension levels could spot 137.36 (161.8% extension) as a likely profit zone. When price reached this level, many scaled out, anticipating resistance while leaving room to adjust as momentum dictated.
In another example, the EUR/ZAR pair during a local political event saw sharp moves where extensions helped guide traders on realistic exits. Instead of guessing, those who respected Fibonacci extensions managed better profit-taking, avoiding turning points where retracements began anew.
Successfully applying Fibonacci extension levels requires practice and market awareness. These levels offer structured targets rooted in market behaviour, but like any tool, they work best alongside sound risk management and confirmation from price action.
Familiarity with these distinctions and practical guidelines equips traders—whether in Johannesburg or Durban—with a tactical edge when navigating forex markets.
Using Fibonacci levels in forex trading can provide clear signals for potential price movements, but managing risk around these signals is just as vital. Traders who combine Fibonacci strategies with solid risk management tend to hold their positions longer and avoid being wiped out by unexpected market swings. Risk management isn't just a backup plan—it’s part of a savvy trading approach.
Stop losses placed near Fibonacci retracement or extension points can act like safety nets. Since these levels often represent support or resistance, putting a stop loss just beyond them allows traders some breathing room while also protecting their capital if the market moves against their position. For example, if you're buying a USD/ZAR pair and see strong support at the 61.8% retracement, setting your stop loss slightly below this level could prevent premature exit during minor price wiggles.
Position sizing is crucial when using Fibonacci tools. Because these levels indicate potential reversal zones, uncertainty is inevitable. Managing how much you risk per trade based on the distance between your entry and stop loss ensures losses stay manageable. If a Fibonacci level sits farther from your entry point, your trade size should shrink accordingly. This keeps overall risk within your tolerances, especially in volatile pairs like EUR/ZAR.
Relying solely on Fibonacci levels can lure traders into false confidence. Markets are complex, and not every bounce or breakout near Fibonacci ratios will follow through. Confirming signals with other indicators helps cut through the noise.
Volume confirmation can greatly improve Fibonacci trade setups. When price approaches a Fibonacci level, increased volume suggests real interest and potential commitment from traders. For instance, if the price retraces to a 50% Fibonacci level and volume spikes, this signals stronger buying or selling pressure supporting the level’s relevance. On the other hand, low volume near key Fibonacci points may warn of a fake-out.
Price action clues like pin bars, engulfing candles, or inside bars near Fibonacci levels provide additional evidence about market sentiment. Suppose the USD/CAD pair pulls back to a 38.2% retracement and forms a bullish engulfing candle; this pattern hints at buyers stepping in, boosting confidence in the Fibonacci support area. Price action analysis helps filter weaker signals, making trades based on Fibonacci tools more reliable.
Combining Fibonacci strategies with robust risk management practices isn’t optional; it’s a way to protect your trading capital while capitalising on high-probability setups.
Integrating these elements ensures you don't just guess where the market might turn—you manage your exposure carefully to stay in the game for the long haul.
Explore proven forex trading strategies tailored for traders in South Africa. Learn smart risk management and pick the right tools 📈💰 to trade effectively.
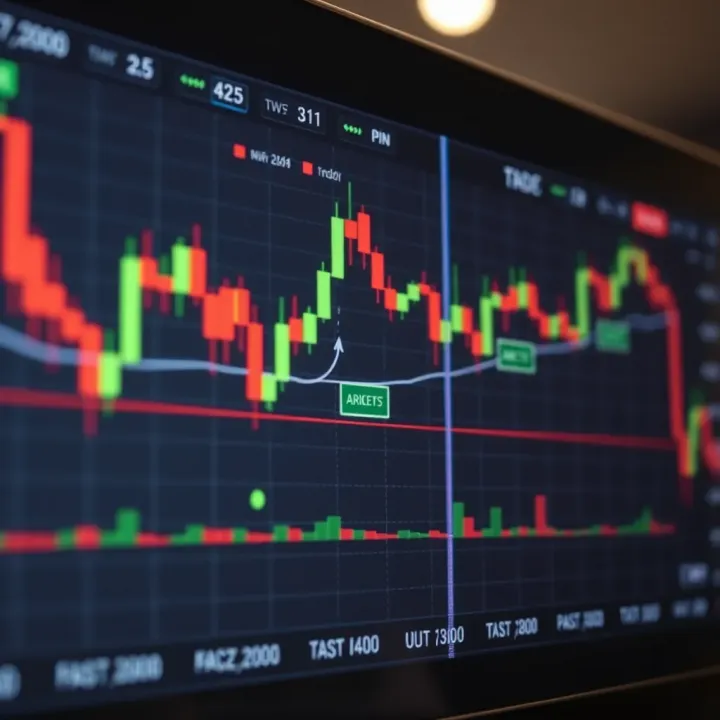
📊 Master essential forex trading strategies to boost your skills! Learn market analysis, risk management, and practical techniques for smarter trading.

📈 Discover proven forex trading strategies for consistent profits. Learn risk management, technical & fundamental analysis, plus tips to refine your plan.

📈 Master essential Forex trading strategies in South Africa! Learn trading styles, risk management, chart analysis, & how to use strategy PDFs effectively. 💹
Based on 13 reviews